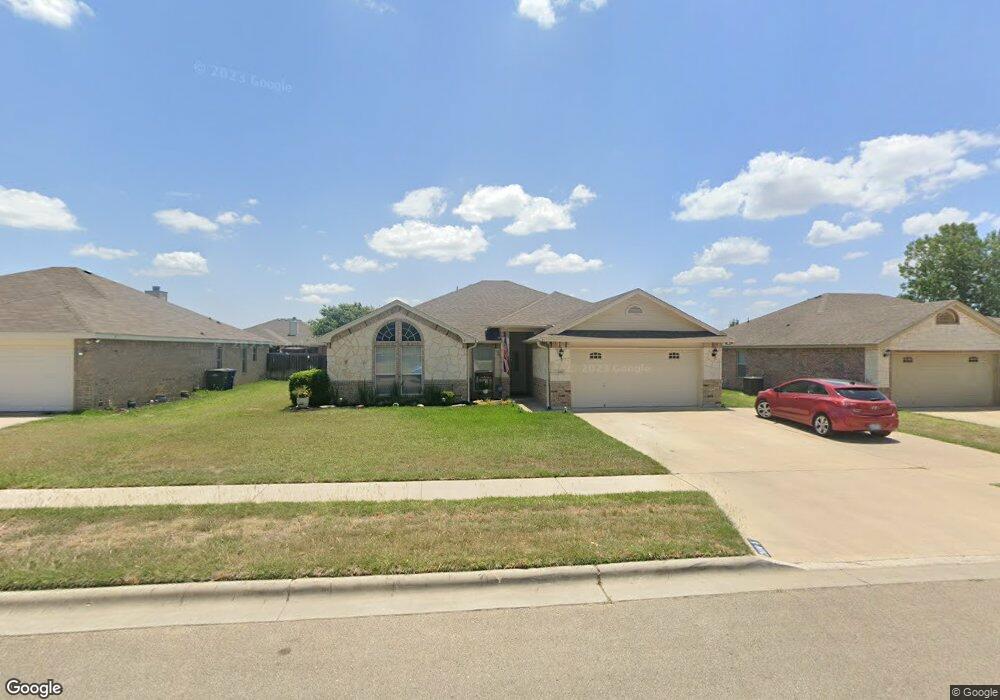
2410 Joseph Dr Copperas Cove, TX 76522
Estimated Value: $235,168 - $247,000
4
Beds
2
Baths
1,687
Sq Ft
$143/Sq Ft
Est. Value
About This Home
This home is located at 2410 Joseph Dr, Copperas Cove, TX 76522 and is currently estimated at $241,084, approximately $142 per square foot. 2410 Joseph Dr is a home located in Coryell County with nearby schools including House Creek Elementary School, S.C. Lee Junior High School, and Copperas Cove High School.
Ownership History
Date
Name
Owned For
Owner Type
Purchase Details
Closed on
May 15, 2009
Sold by
Turner Rodney A and Turner Paula A
Bought by
Brown Harold T
Current Estimated Value
Home Financials for this Owner
Home Financials are based on the most recent Mortgage that was taken out on this home.
Original Mortgage
$149,139
Outstanding Balance
$94,179
Interest Rate
4.84%
Estimated Equity
$146,905
Purchase Details
Closed on
Nov 6, 2006
Sold by
Battreal Dan
Bought by
Turner Rodney A and Turner Paula A
Home Financials for this Owner
Home Financials are based on the most recent Mortgage that was taken out on this home.
Original Mortgage
$144,031
Interest Rate
6.26%
Create a Home Valuation Report for This Property
The Home Valuation Report is an in-depth analysis detailing your home's value as well as a comparison with similar homes in the area
Home Values in the Area
Average Home Value in this Area
Purchase History
| Date | Buyer | Sale Price | Title Company |
|---|---|---|---|
| Brown Harold T | -- | -- | |
| Turner Rodney A | -- | -- | |
| Battreal Dan | -- | -- |
Source: Public Records
Mortgage History
| Date | Status | Borrower | Loan Amount |
|---|---|---|---|
| Open | Brown Harold T | $149,139 | |
| Previous Owner | Turner Rodney A | $144,031 |
Source: Public Records
Tax History Compared to Growth
Tax History
| Year | Tax Paid | Tax Assessment Tax Assessment Total Assessment is a certain percentage of the fair market value that is determined by local assessors to be the total taxable value of land and additions on the property. | Land | Improvement |
|---|---|---|---|---|
| 2025 | -- | $228,404 | -- | -- |
| 2023 | $3,716 | $188,764 | $0 | $0 |
| 2022 | $3,850 | $207,470 | $40,000 | $167,470 |
| 2021 | $4,021 | $161,700 | $25,000 | $136,700 |
| 2020 | $3,714 | $141,822 | $22,000 | $119,822 |
| 2019 | $3,736 | $137,770 | $22,000 | $115,770 |
| 2018 | $3,746 | $138,060 | $22,000 | $116,060 |
| 2017 | $3,644 | $137,030 | $22,000 | $115,030 |
| 2016 | $3,647 | $137,150 | $22,000 | $115,150 |
| 2015 | $3,050 | $132,560 | $22,000 | $110,560 |
| 2014 | $3,050 | $137,130 | $22,000 | $115,130 |
Source: Public Records
Map
Nearby Homes