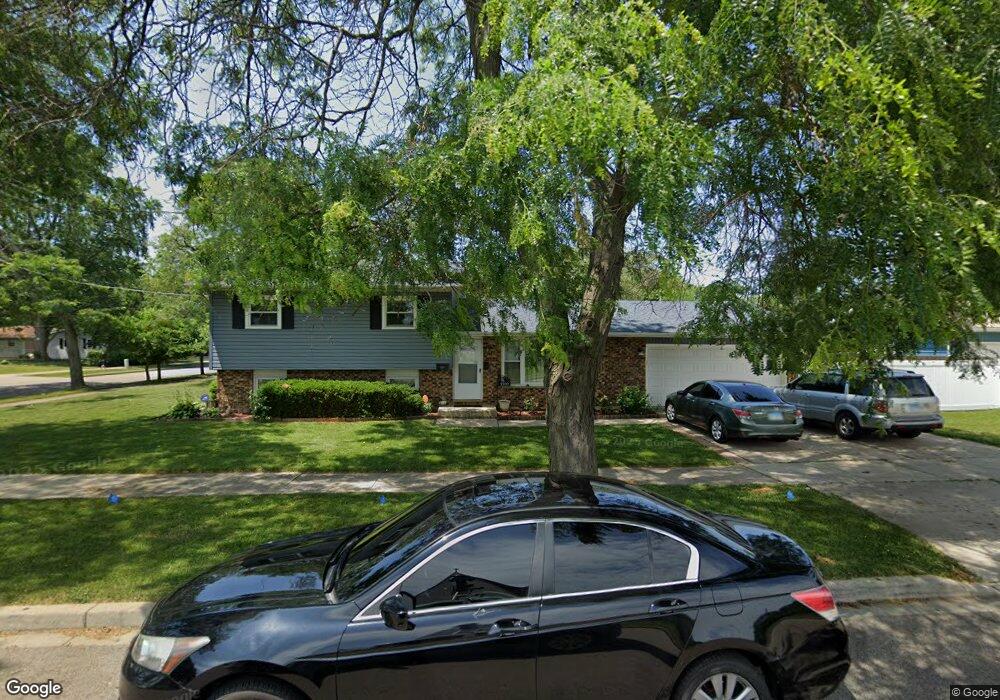
2410 N Butrick St Waukegan, IL 60087
Marquette Highlands NeighborhoodEstimated Value: $221,000 - $262,150
3
Beds
2
Baths
1,057
Sq Ft
$235/Sq Ft
Est. Value
About This Home
This home is located at 2410 N Butrick St, Waukegan, IL 60087 and is currently estimated at $248,788, approximately $235 per square foot. 2410 N Butrick St is a home located in Lake County with nearby schools including Little Fort Elementary School, Jack Benny Middle School, and Waukegan High School.
Ownership History
Date
Name
Owned For
Owner Type
Purchase Details
Closed on
Nov 5, 2021
Sold by
Ortega Juan
Bought by
Ortega Nelson
Current Estimated Value
Purchase Details
Closed on
Nov 9, 2011
Sold by
Villalobos Jose Luis
Bought by
Ortega Juan Francisco
Home Financials for this Owner
Home Financials are based on the most recent Mortgage that was taken out on this home.
Original Mortgage
$63,352
Outstanding Balance
$43,677
Interest Rate
4.25%
Mortgage Type
FHA
Estimated Equity
$205,111
Purchase Details
Closed on
Nov 17, 2003
Sold by
Calupe Rolando A and Calupe Milagros F
Bought by
Villalobos Jose Luis
Home Financials for this Owner
Home Financials are based on the most recent Mortgage that was taken out on this home.
Original Mortgage
$158,600
Interest Rate
6.1%
Mortgage Type
Purchase Money Mortgage
Create a Home Valuation Report for This Property
The Home Valuation Report is an in-depth analysis detailing your home's value as well as a comparison with similar homes in the area
Home Values in the Area
Average Home Value in this Area
Purchase History
| Date | Buyer | Sale Price | Title Company |
|---|---|---|---|
| Ortega Nelson | -- | None Available | |
| Ortega Juan Francisco | $65,000 | St | |
| Villalobos Jose Luis | $167,000 | First American Title |
Source: Public Records
Mortgage History
| Date | Status | Borrower | Loan Amount |
|---|---|---|---|
| Open | Ortega Juan Francisco | $63,352 | |
| Previous Owner | Villalobos Jose Luis | $158,600 |
Source: Public Records
Tax History Compared to Growth
Tax History
| Year | Tax Paid | Tax Assessment Tax Assessment Total Assessment is a certain percentage of the fair market value that is determined by local assessors to be the total taxable value of land and additions on the property. | Land | Improvement |
|---|---|---|---|---|
| 2024 | $4,453 | $71,905 | $11,650 | $60,255 |
| 2023 | $4,766 | $63,227 | $10,244 | $52,983 |
| 2022 | $4,766 | $59,748 | $9,714 | $50,034 |
| 2021 | $4,787 | $56,918 | $9,126 | $47,792 |
| 2020 | $4,764 | $53,026 | $8,502 | $44,524 |
| 2019 | $4,698 | $48,590 | $7,791 | $40,799 |
| 2018 | $3,696 | $40,281 | $9,188 | $31,093 |
| 2017 | $3,505 | $35,638 | $8,129 | $27,509 |
| 2016 | $3,086 | $30,968 | $7,064 | $23,904 |
| 2015 | $2,824 | $27,716 | $6,322 | $21,394 |
| 2014 | $2,555 | $20,638 | $7,279 | $13,359 |
| 2012 | $2,521 | $22,359 | $7,886 | $14,473 |
Source: Public Records
Map
Nearby Homes
- 2350 N Lewis Ave
- 2613 N Lewis Ave
- 1905 Linden Ave
- 1015 Merton Ave
- 1636 Rice St
- 2345 N Mcaree Rd
- 0 Traditions Dr
- 843 W Johns Manville Place
- 1018 W Atlantic Ave
- 2207 Williamsburg Dr
- 2705 Dana Ave
- 2440 W Cheyenne Rd
- 616 W Keith Ave
- 2708 Dana Ave
- 2713 Varonen Ave
- 2924 W Bonnie Brook Ln
- 2246 Alta Vista Dr
- 2009 Harding Ave
- 2213 Alta Vista Dr
- 37905 N Loyola Ave
- 1410 Montesano Ave
- 2412 N Butrick St
- 1412 Montesano Ave
- 2411 Yeoman St
- 2403 Yeoman St
- 1415 Montesano Ave
- 2419 Yeoman St
- 2430 N Butrick St
- 2333 Yeoman St
- 2425 Yeoman St
- 2432 N Butrick St
- 2329 Yeoman St
- 2431 Yeoman St
- 1510 Montesano Ave
- 2410 Yeoman St
- 2436 N Butrick St
- 2412 Yeoman St
- 2325 Yeoman St
- 2433 Yeoman St
- 2420 Yeoman St