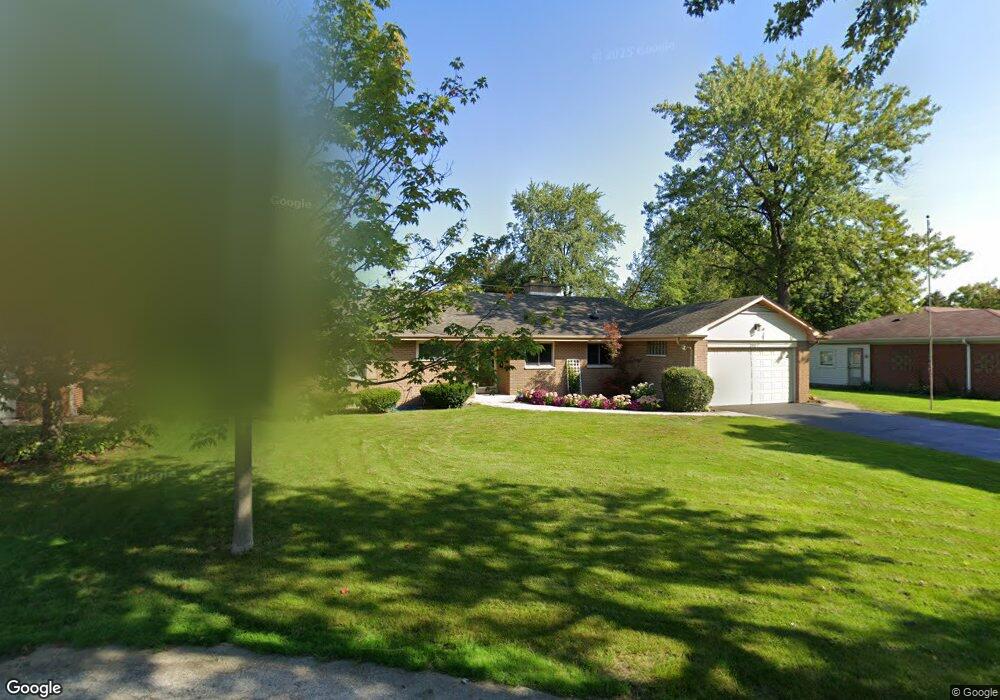
2410 Sumac Cir Glenview, IL 60025
Estimated Value: $776,672 - $882,000
3
Beds
3
Baths
1,781
Sq Ft
$464/Sq Ft
Est. Value
About This Home
This home is located at 2410 Sumac Cir, Glenview, IL 60025 and is currently estimated at $827,168, approximately $464 per square foot. 2410 Sumac Cir is a home located in Cook County with nearby schools including Lyon Elementary School, Pleasant Ridge Elementary School, and Springman Middle School.
Ownership History
Date
Name
Owned For
Owner Type
Purchase Details
Closed on
Jun 23, 2016
Sold by
Kamajian Brian and Hamajian Margaret
Bought by
Kamajian Brian L and Kamajian Margaret
Current Estimated Value
Purchase Details
Closed on
Jan 22, 1998
Sold by
Radzinski Chester W and Radzinski Eleanor H
Bought by
Kamajian Brian and Kamajian Margaret
Home Financials for this Owner
Home Financials are based on the most recent Mortgage that was taken out on this home.
Original Mortgage
$200,000
Outstanding Balance
$31,542
Interest Rate
7.24%
Estimated Equity
$795,627
Create a Home Valuation Report for This Property
The Home Valuation Report is an in-depth analysis detailing your home's value as well as a comparison with similar homes in the area
Home Values in the Area
Average Home Value in this Area
Purchase History
| Date | Buyer | Sale Price | Title Company |
|---|---|---|---|
| Kamajian Brian L | -- | Attorney | |
| Kamajian Brian | $316,000 | -- |
Source: Public Records
Mortgage History
| Date | Status | Borrower | Loan Amount |
|---|---|---|---|
| Open | Kamajian Brian | $200,000 |
Source: Public Records
Tax History
| Year | Tax Paid | Tax Assessment Tax Assessment Total Assessment is a certain percentage of the fair market value that is determined by local assessors to be the total taxable value of land and additions on the property. | Land | Improvement |
|---|---|---|---|---|
| 2025 | $12,933 | $80,000 | $20,642 | $59,358 |
| 2024 | $12,933 | $61,747 | $17,382 | $44,365 |
| 2023 | $12,546 | $61,747 | $17,382 | $44,365 |
| 2022 | $12,546 | $61,747 | $17,382 | $44,365 |
| 2021 | $10,713 | $46,374 | $14,123 | $32,251 |
| 2020 | $10,642 | $46,374 | $14,123 | $32,251 |
| 2019 | $9,914 | $50,961 | $14,123 | $36,838 |
| 2018 | $10,094 | $47,326 | $12,222 | $35,104 |
| 2017 | $10,752 | $51,404 | $12,222 | $39,182 |
| 2016 | $10,718 | $53,167 | $12,222 | $40,945 |
| 2015 | $10,186 | $45,397 | $9,777 | $35,620 |
| 2014 | $10,012 | $45,397 | $9,777 | $35,620 |
| 2013 | $9,693 | $45,397 | $9,777 | $35,620 |
Source: Public Records
Map
Nearby Homes
Your Personal Tour Guide
Ask me questions while you tour the home.