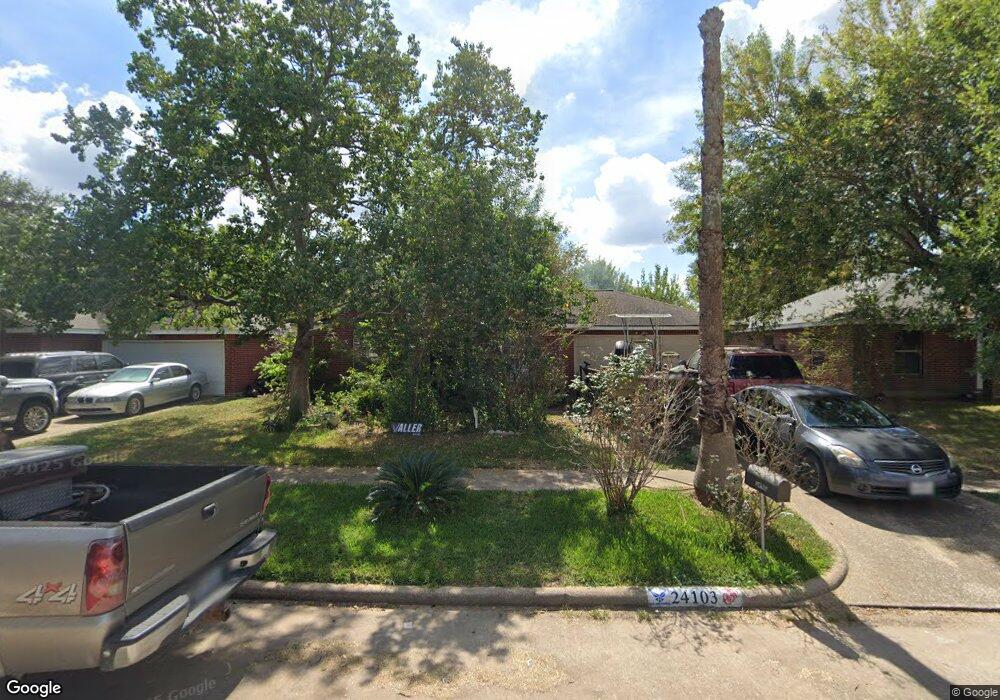
24103 Broken Bow Ln Hockley, TX 77447
Hockley NeighborhoodEstimated Value: $205,855 - $223,000
3
Beds
2
Baths
1,191
Sq Ft
$180/Sq Ft
Est. Value
About This Home
This home is located at 24103 Broken Bow Ln, Hockley, TX 77447 and is currently estimated at $214,714, approximately $180 per square foot. 24103 Broken Bow Ln is a home located in Harris County with nearby schools including Roberts Road Elementary School, Waller Junior High School, and Waller High School.
Ownership History
Date
Name
Owned For
Owner Type
Purchase Details
Closed on
Oct 10, 2003
Sold by
Henry George R and Keller Yavonne E
Bought by
Williams Tanzanyika C and Carter Julian L
Current Estimated Value
Home Financials for this Owner
Home Financials are based on the most recent Mortgage that was taken out on this home.
Original Mortgage
$69,451
Outstanding Balance
$31,920
Interest Rate
5.99%
Mortgage Type
FHA
Estimated Equity
$182,794
Purchase Details
Closed on
Oct 3, 1995
Sold by
Ranch Country Development Llc
Bought by
Henry George R and Keller Yavonne E
Home Financials for this Owner
Home Financials are based on the most recent Mortgage that was taken out on this home.
Original Mortgage
$56,580
Interest Rate
7.5%
Mortgage Type
Purchase Money Mortgage
Purchase Details
Closed on
Sep 12, 1995
Sold by
Ranch Country Development Llc
Bought by
Romero Melanie E
Home Financials for this Owner
Home Financials are based on the most recent Mortgage that was taken out on this home.
Original Mortgage
$56,580
Interest Rate
7.5%
Mortgage Type
Purchase Money Mortgage
Create a Home Valuation Report for This Property
The Home Valuation Report is an in-depth analysis detailing your home's value as well as a comparison with similar homes in the area
Home Values in the Area
Average Home Value in this Area
Purchase History
| Date | Buyer | Sale Price | Title Company |
|---|---|---|---|
| Williams Tanzanyika C | -- | Fidelity National Title | |
| Henry George R | -- | Regency Title | |
| Romero Melanie E | -- | Regency Title | |
| Ochoa James L | -- | Regency Title |
Source: Public Records
Mortgage History
| Date | Status | Borrower | Loan Amount |
|---|---|---|---|
| Open | Williams Tanzanyika C | $69,451 | |
| Previous Owner | Henry George R | $56,580 | |
| Previous Owner | Ochoa James L | $56,580 |
Source: Public Records
Tax History Compared to Growth
Tax History
| Year | Tax Paid | Tax Assessment Tax Assessment Total Assessment is a certain percentage of the fair market value that is determined by local assessors to be the total taxable value of land and additions on the property. | Land | Improvement |
|---|---|---|---|---|
| 2025 | $2,610 | $206,381 | $34,650 | $171,731 |
| 2024 | $2,610 | $201,032 | $34,650 | $166,382 |
| 2023 | $2,610 | $203,443 | $34,650 | $168,793 |
| 2022 | $3,470 | $177,336 | $34,650 | $142,686 |
| 2021 | $3,303 | $146,262 | $28,350 | $117,912 |
| 2020 | $3,100 | $129,906 | $26,775 | $103,131 |
| 2019 | $2,914 | $129,906 | $22,050 | $107,856 |
| 2018 | $629 | $111,922 | $22,050 | $89,872 |
| 2017 | $2,385 | $111,922 | $22,050 | $89,872 |
| 2016 | $2,168 | $99,217 | $22,050 | $77,167 |
| 2015 | $1,138 | $86,251 | $15,120 | $71,131 |
| 2014 | $1,138 | $60,624 | $15,120 | $45,504 |
Source: Public Records
Map
Nearby Homes
- 24039 Rockin Seven Dr
- 17503 Lavender Blossom Ln
- 17419 Lavender Blossom Ln
- 17423 Lavender Blossom Ln
- 32115 Waterlily View Ct
- 17607 Lavender Blossom Ln
- Tyler Plan at Dellrose
- Cypress Plan at Dellrose
- Edison Plan at Dellrose
- Dawson Plan at Dellrose
- Hyde Plan at Dellrose
- Cheyenne Plan at Dellrose
- Avery Plan at Dellrose
- Katy Plan at Dellrose
- 24310 Rockin Seven Dr
- 17506 Bullis Gap Dr
- 32103 Sweet Pea Meadows Dr
- 32114 Sweet Pea Meadows Dr
- 32135 Sweet Pea Meadows Dr
- 32123 Sweet Pea Meadows Dr
- 24107 Broken Bow Ln
- 24031 Broken Bow Ln
- 24034 Rockin Seven Dr
- 24038 Rockin Seven Dr
- 24027 Broken Bow Ln
- 24030 Rockin Seven Dr
- 24042 Rockin Seven Dr
- 24102 Broken Bow Ln
- 24026 Rockin Seven Dr
- 24030 Broken Bow Ln
- 24106 Broken Bow Ln
- 24115 Broken Bow Ln
- 24023 Broken Bow Ln
- 24026 Broken Bow Ln
- 24110 Broken Bow Ln
- 24046 Rockin Seven Dr
- 24022 Rockin Seven Dr
- 24119 Broken Bow Ln
- 24022 Broken Bow Ln
- 24114 Broken Bow Ln