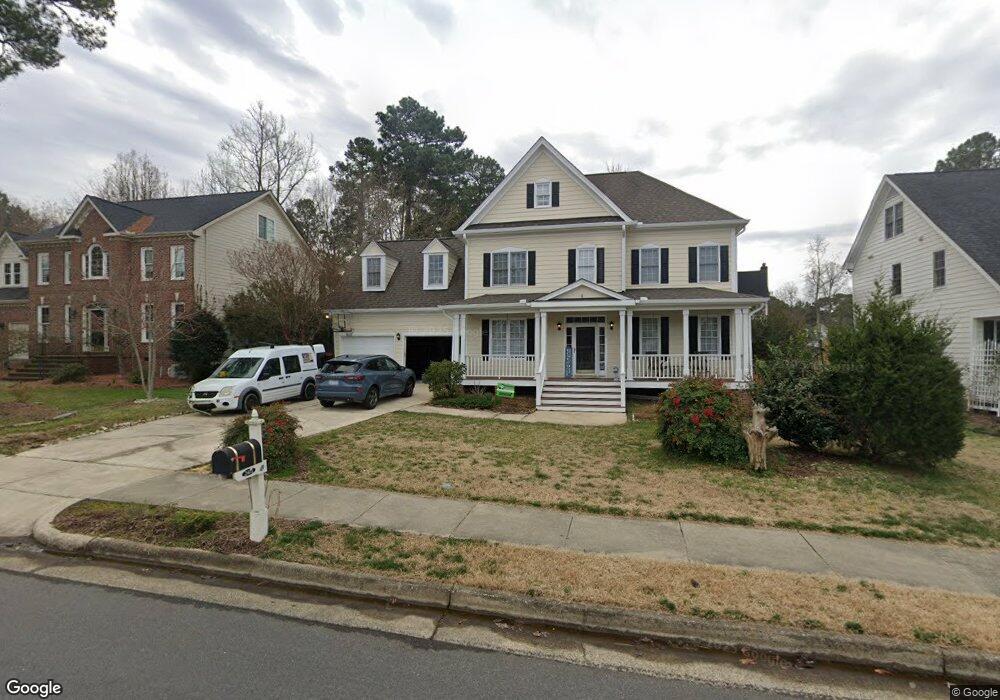
2411 Bristers Spring Way Apex, NC 27523
Beaver Creek NeighborhoodEstimated Value: $645,000 - $715,000
4
Beds
3
Baths
2,726
Sq Ft
$248/Sq Ft
Est. Value
About This Home
This home is located at 2411 Bristers Spring Way, Apex, NC 27523 and is currently estimated at $675,101, approximately $247 per square foot. 2411 Bristers Spring Way is a home located in Wake County with nearby schools including Turner Creek Elementary School, Salem Middle, and Green Level High School.
Ownership History
Date
Name
Owned For
Owner Type
Purchase Details
Closed on
Jun 19, 2017
Sold by
Groom Sean Wn and Dunkel Groom Robin E
Bought by
Den Hartog Emiel A and Hoeflaken Kirsten M
Current Estimated Value
Home Financials for this Owner
Home Financials are based on the most recent Mortgage that was taken out on this home.
Original Mortgage
$363,500
Outstanding Balance
$302,356
Interest Rate
4.02%
Mortgage Type
New Conventional
Estimated Equity
$372,745
Purchase Details
Closed on
Oct 6, 1999
Sold by
W T Barker Construction Company
Bought by
Groom Sean Wm and Groom Robin E Dunkel
Home Financials for this Owner
Home Financials are based on the most recent Mortgage that was taken out on this home.
Original Mortgage
$196,000
Interest Rate
7.79%
Create a Home Valuation Report for This Property
The Home Valuation Report is an in-depth analysis detailing your home's value as well as a comparison with similar homes in the area
Home Values in the Area
Average Home Value in this Area
Purchase History
| Date | Buyer | Sale Price | Title Company |
|---|---|---|---|
| Den Hartog Emiel A | $375,000 | None Available | |
| Groom Sean Wm | $248,000 | -- |
Source: Public Records
Mortgage History
| Date | Status | Borrower | Loan Amount |
|---|---|---|---|
| Open | Den Hartog Emiel A | $363,500 | |
| Previous Owner | Groom Sean Wm | $196,000 |
Source: Public Records
Tax History Compared to Growth
Tax History
| Year | Tax Paid | Tax Assessment Tax Assessment Total Assessment is a certain percentage of the fair market value that is determined by local assessors to be the total taxable value of land and additions on the property. | Land | Improvement |
|---|---|---|---|---|
| 2025 | $5,490 | $626,473 | $220,000 | $406,473 |
| 2024 | $5,367 | $626,473 | $220,000 | $406,473 |
| 2023 | $4,221 | $382,957 | $85,000 | $297,957 |
| 2022 | $3,963 | $382,957 | $85,000 | $297,957 |
| 2021 | $3,811 | $382,957 | $85,000 | $297,957 |
| 2020 | $3,773 | $382,957 | $85,000 | $297,957 |
| 2019 | $4,025 | $352,629 | $80,000 | $272,629 |
| 2018 | $3,791 | $352,629 | $80,000 | $272,629 |
| 2017 | $3,529 | $352,629 | $80,000 | $272,629 |
| 2016 | $3,478 | $352,629 | $80,000 | $272,629 |
| 2015 | $3,457 | $342,160 | $70,000 | $272,160 |
| 2014 | -- | $339,319 | $70,000 | $269,319 |
Source: Public Records
Map
Nearby Homes
- 2208 Good Shepherd Way
- 1622 Shepherds Glade Dr
- 1633 Shepherds Glade Dr
- 2300 Walden Creek Dr
- 2122 Grouse Ski Cir
- 2115 Grouse Ski Cir
- 2134 Grouse Ski Cir
- 2127 Grouse Ski Cir
- 2060 Jersey City Place
- 831 Tunisian Dr
- 7242 Morris Acres Rd
- 2201 Dial Dr
- 479 Clark Creek Ln
- 2126 Whitesmith Dr
- 1001 Drayman Place
- 1038 Brownsmith Dr
- 2013 Keokuk Ct
- 2007 Ackerman Hill Dr
- 553 Duggins Point
- 709 Oak Ridge Dr
- 2409 Bristers Spring Way
- 2413 Bristers Spring Way
- 2328 Walden Creek Dr
- 2326 Walden Creek Dr
- 2407 Bristers Spring Way
- 2419 Bristers Spring Way
- 2410 Bristers Spring Way
- 2412 Bristers Spring Way
- 2408 Bristers Spring Way
- 2423 Bristers Spring Way
- 2324 Walden Creek Dr
- 2405 Bristers Spring Way
- 2416 Bristers Spring Way
- 2406 Bristers Spring Way
- 1703 Squaw Walden Ln
- 2418 Bristers Spring Way
- 2101 Good Sheperd Way
- 2009 Good Sheperd Way
- 2101 Good Shepherd Way
- 2009 Good Shepherd Way