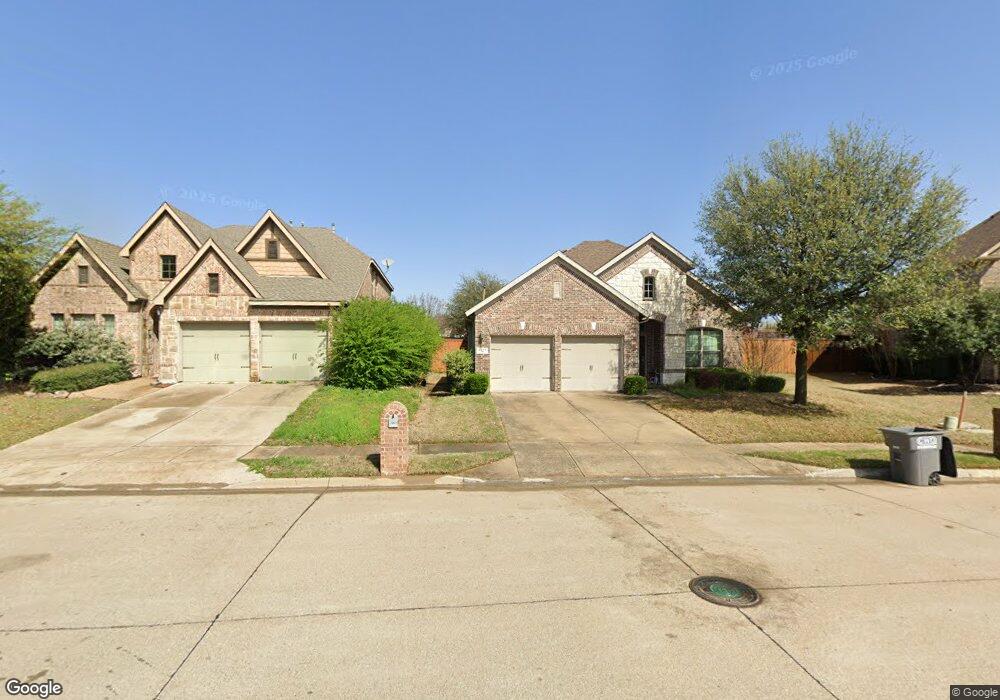
2411 Cotillion Dr Sachse, TX 75048
Estimated Value: $439,528 - $497,000
3
Beds
2
Baths
2,175
Sq Ft
$216/Sq Ft
Est. Value
About This Home
This home is located at 2411 Cotillion Dr, Sachse, TX 75048 and is currently estimated at $470,882, approximately $216 per square foot. 2411 Cotillion Dr is a home located in Dallas County with nearby schools including Garland Christian Academy.
Ownership History
Date
Name
Owned For
Owner Type
Purchase Details
Closed on
Oct 3, 2016
Sold by
Jackson Damon R and Jackson Gwendolyn Joyce
Bought by
Burns Michael
Current Estimated Value
Home Financials for this Owner
Home Financials are based on the most recent Mortgage that was taken out on this home.
Original Mortgage
$168,000
Outstanding Balance
$134,555
Interest Rate
3.43%
Estimated Equity
$336,327
Purchase Details
Closed on
Jul 17, 2014
Sold by
North Texas Tollway Authority
Bought by
Wycliff Tollway Ltd
Purchase Details
Closed on
Feb 9, 2012
Sold by
Mhi Partnership Ltd
Bought by
Jackson Damon R and Jackson Gwendoln Joyce
Home Financials for this Owner
Home Financials are based on the most recent Mortgage that was taken out on this home.
Original Mortgage
$183,506
Interest Rate
3.95%
Mortgage Type
New Conventional
Purchase Details
Closed on
Aug 25, 2011
Sold by
Jackson Meadows Partners Lp
Bought by
Mhi Partnership Ltd
Create a Home Valuation Report for This Property
The Home Valuation Report is an in-depth analysis detailing your home's value as well as a comparison with similar homes in the area
Home Values in the Area
Average Home Value in this Area
Purchase History
| Date | Buyer | Sale Price | Title Company |
|---|---|---|---|
| Burns Michael | -- | None Available | |
| Wycliff Tollway Ltd | -- | Republic Title Of Texas Inc | |
| Jackson Damon R | -- | Stewart | |
| Mhi Partnership Ltd | -- | Stc |
Source: Public Records
Mortgage History
| Date | Status | Borrower | Loan Amount |
|---|---|---|---|
| Open | Burns Michael | $168,000 | |
| Previous Owner | Jackson Damon R | $183,506 |
Source: Public Records
Tax History Compared to Growth
Tax History
| Year | Tax Paid | Tax Assessment Tax Assessment Total Assessment is a certain percentage of the fair market value that is determined by local assessors to be the total taxable value of land and additions on the property. | Land | Improvement |
|---|---|---|---|---|
| 2025 | $7,394 | $476,160 | $85,000 | $391,160 |
| 2024 | $7,394 | $476,160 | $85,000 | $391,160 |
| 2023 | $7,394 | $400,480 | $70,000 | $330,480 |
| 2022 | $9,582 | $400,480 | $70,000 | $330,480 |
| 2021 | $7,673 | $298,170 | $65,000 | $233,170 |
| 2020 | $7,801 | $298,170 | $65,000 | $233,170 |
| 2019 | $8,458 | $298,170 | $65,000 | $233,170 |
| 2018 | $7,836 | $273,620 | $50,000 | $223,620 |
| 2017 | $3,482 | $273,620 | $50,000 | $223,620 |
| 2016 | $7,858 | $273,620 | $50,000 | $223,620 |
| 2015 | $5,431 | $242,460 | $50,000 | $192,460 |
| 2014 | $5,431 | $225,150 | $50,000 | $175,150 |
Source: Public Records
Map
Nearby Homes
- 2402 Bent Oak Trail
- 2406 Bent Oak Trail
- 2422 Ash Ln
- 2418 Ash Ln
- 2414 Ash Ln
- 2402 Ash Ln
- 1641 Ben Davis Rd
- TBS Hwy78
- 4406 Westcreek Ln
- 4005 Hawthorne Dr
- 2006 Cornwall Ln
- 4818 Westcreek Ln
- 5007 Jefferson Dr
- 5014 Brookhollow Dr
- 4924 Westcreek Ln
- 5100 Murphy Rd
- 2209 Vicksburg Dr
- 3417 Rosewood Ln
- 3476 Rosewood Ln
- 5117 Greensboro Dr
- 2407 Cotillion Dr
- 2501 Cotillion Dr
- 2505 Cotillion Dr
- 2403 Cotillion Dr
- 4523 Swingster Ln
- 2502 Cotillion Dr
- 2509 Cotillion Dr
- 4519 Swingster Ln
- 2506 Cotillion Dr
- 2513 Cotillion Dr
- 4515 Swingster Ln
- 2510 Cotillion Dr
- 2517 Cotillion Dr
- 4508 Swingster Ln
- 2514 Cotillion Dr
- 4511 Swingster Ln
- 2521 Cotillion Dr
- 4507 Swingster Ln
- 2518 Cotillion Dr
- 4504 Swingster Ln