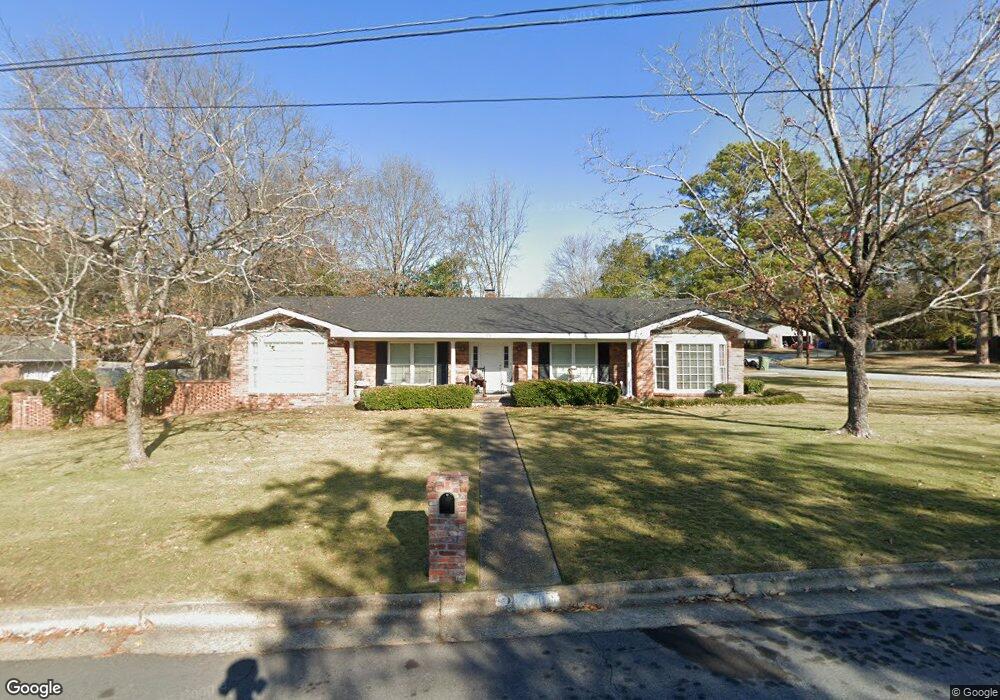
2411 Devonshire Dr Columbus, GA 31904
North Columbus NeighborhoodEstimated Value: $237,000 - $255,000
4
Beds
4
Baths
2,022
Sq Ft
$122/Sq Ft
Est. Value
About This Home
This home is located at 2411 Devonshire Dr, Columbus, GA 31904 and is currently estimated at $247,599, approximately $122 per square foot. 2411 Devonshire Dr is a home located in Muscogee County with nearby schools including Allen Elementary School, Arnold Middle School, and Jordan Vocational High School.
Ownership History
Date
Name
Owned For
Owner Type
Purchase Details
Closed on
Oct 27, 2015
Sold by
Farley Arnold
Bought by
Harris Verlinda
Current Estimated Value
Purchase Details
Closed on
Mar 4, 2011
Sold by
Colon Inge
Bought by
Farley Arnold and Farley Verlinda J
Home Financials for this Owner
Home Financials are based on the most recent Mortgage that was taken out on this home.
Original Mortgage
$160,817
Interest Rate
4.75%
Mortgage Type
FHA
Purchase Details
Closed on
Sep 28, 2010
Sold by
Taylor Marion Allan
Bought by
Colon Inge
Home Financials for this Owner
Home Financials are based on the most recent Mortgage that was taken out on this home.
Original Mortgage
$78,000
Interest Rate
4.44%
Mortgage Type
Seller Take Back
Create a Home Valuation Report for This Property
The Home Valuation Report is an in-depth analysis detailing your home's value as well as a comparison with similar homes in the area
Home Values in the Area
Average Home Value in this Area
Purchase History
| Date | Buyer | Sale Price | Title Company |
|---|---|---|---|
| Harris Verlinda | -- | -- | |
| Harris Verlinda | -- | -- | |
| Farley Arnold | $165,000 | None Available | |
| Colon Inge | $108,000 | None Available |
Source: Public Records
Mortgage History
| Date | Status | Borrower | Loan Amount |
|---|---|---|---|
| Previous Owner | Farley Arnold | $160,817 | |
| Previous Owner | Colon Inge | $78,000 |
Source: Public Records
Tax History
| Year | Tax Paid | Tax Assessment Tax Assessment Total Assessment is a certain percentage of the fair market value that is determined by local assessors to be the total taxable value of land and additions on the property. | Land | Improvement |
|---|---|---|---|---|
| 2025 | $1,742 | $83,552 | $11,024 | $72,528 |
| 2024 | $1,742 | $83,552 | $11,024 | $72,528 |
| 2023 | $106 | $83,552 | $11,024 | $72,528 |
| 2022 | $1,817 | $63,644 | $11,024 | $52,620 |
| 2021 | $1,817 | $59,880 | $11,024 | $48,856 |
| 2020 | $1,817 | $59,880 | $11,024 | $48,856 |
| 2019 | $1,823 | $59,880 | $11,024 | $48,856 |
| 2018 | $1,823 | $59,880 | $11,024 | $48,856 |
| 2017 | $2,166 | $59,880 | $11,024 | $48,856 |
| 2016 | $2,175 | $67,177 | $8,175 | $59,002 |
| 2015 | $2,178 | $67,177 | $8,175 | $59,002 |
| 2014 | $2,182 | $67,177 | $8,175 | $59,002 |
| 2013 | -- | $67,177 | $8,175 | $59,002 |
Source: Public Records
Map
Nearby Homes
- 2322 Winchester Dr
- 2307 Winchester Dr
- 4310 Acacia Dr
- 4526 19th Ave
- 5224 23rd Ave
- 4122 Acacia Dr
- 4303 Armour Rd
- 2325 Coventry Dr
- 4212 Chalfonte Dr
- 5235 23rd Ave
- 4830 17th Ave
- 2000 Lancaster Dr
- 2110 Terrace Dr
- 4214 17th Ave
- 3600 23rd Ave
- 2369 Gurley Dr
- 2345 Gurley Dr
- 3640 Calvin Dr
- 2515 Camille Dr
- 2257 Camille Dr
- 2403 Devonshire Dr
- 2414 Winchester Dr
- 4716 Saint Francis Ave
- 4708 Saint Francis Ave
- 2406 Winchester Dr
- 4716 St Francis Ave
- 2335 Devonshire Dr
- 4700 Saint Francis Ave
- 2329 Devonshire Dr
- 4800 Saint Francis Ave
- 4805 Saint Francis Ave
- 4616 Saint Francis Ave
- 2328 Winchester Dr
- 2332 Devonshire Dr
- 4802 Chesil Ave
- 4806 Saint Francis Ave
- 4705 Rosemont Dr
- 4635 Rosemont Dr
- 4629 Rosemont Dr Unit SI ID1043476P
- 4629 Rosemont Dr Unit SI ID1043904P
Your Personal Tour Guide
Ask me questions while you tour the home.