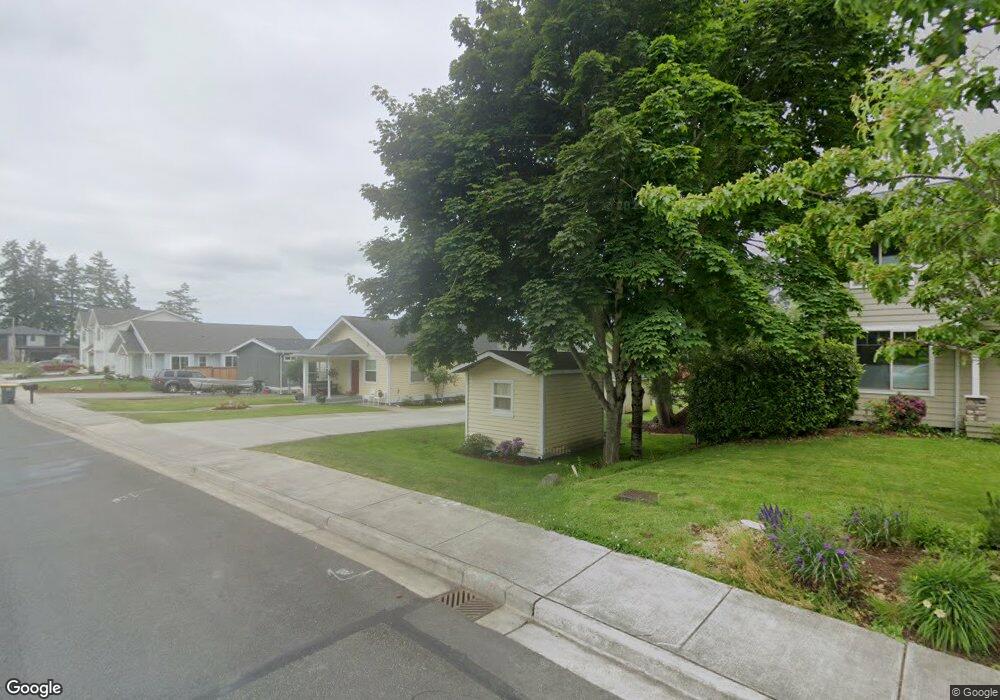
2411 Dodd Ave Blaine, WA 98230
Estimated Value: $386,000 - $477,000
2
Beds
1
Bath
912
Sq Ft
$466/Sq Ft
Est. Value
About This Home
This home is located at 2411 Dodd Ave, Blaine, WA 98230 and is currently estimated at $425,316, approximately $466 per square foot. 2411 Dodd Ave is a home located in Whatcom County with nearby schools including Blaine Primary School, Blaine Elementary School, and Blaine Middle School.
Ownership History
Date
Name
Owned For
Owner Type
Purchase Details
Closed on
Dec 12, 2018
Sold by
Regulinski Stephan G and Myers Christine
Bought by
Hahs Kenneth and Hahs Deirdre
Current Estimated Value
Purchase Details
Closed on
Sep 6, 2006
Sold by
Failor Jason C and Sanders Christiana L
Bought by
Regulinski Stephen G and Myers Christine
Home Financials for this Owner
Home Financials are based on the most recent Mortgage that was taken out on this home.
Original Mortgage
$231,200
Interest Rate
6.56%
Mortgage Type
New Conventional
Purchase Details
Closed on
May 17, 2004
Sold by
Strandell Darren and Strandell Lauri
Bought by
Failor Jason C and Sanders Christiana L
Home Financials for this Owner
Home Financials are based on the most recent Mortgage that was taken out on this home.
Original Mortgage
$134,587
Interest Rate
5.77%
Mortgage Type
FHA
Create a Home Valuation Report for This Property
The Home Valuation Report is an in-depth analysis detailing your home's value as well as a comparison with similar homes in the area
Home Values in the Area
Average Home Value in this Area
Purchase History
| Date | Buyer | Sale Price | Title Company |
|---|---|---|---|
| Hahs Kenneth | $264,725 | Whatcom Land Title | |
| Regulinski Stephen G | $289,280 | Chicago Title Insurance | |
| Failor Jason C | $136,702 | Stewart Title Company |
Source: Public Records
Mortgage History
| Date | Status | Borrower | Loan Amount |
|---|---|---|---|
| Previous Owner | Regulinski Stephen G | $231,200 | |
| Previous Owner | Failor Jason C | $134,587 |
Source: Public Records
Tax History Compared to Growth
Tax History
| Year | Tax Paid | Tax Assessment Tax Assessment Total Assessment is a certain percentage of the fair market value that is determined by local assessors to be the total taxable value of land and additions on the property. | Land | Improvement |
|---|---|---|---|---|
| 2024 | $2,415 | $358,466 | $166,500 | $191,966 |
| 2023 | $2,415 | $358,466 | $166,500 | $191,966 |
| 2022 | $2,016 | $322,942 | $150,000 | $172,942 |
| 2021 | $1,854 | $231,034 | $123,855 | $107,179 |
| 2020 | $1,764 | $193,719 | $100,520 | $93,199 |
| 2019 | $1,765 | $177,396 | $92,050 | $85,346 |
| 2018 | $1,640 | $173,158 | $95,600 | $77,558 |
| 2017 | $1,463 | $144,902 | $80,000 | $64,902 |
| 2016 | $1,525 | $144,902 | $80,000 | $64,902 |
| 2015 | $1,495 | $145,800 | $75,278 | $70,522 |
| 2014 | -- | $139,526 | $72,038 | $67,488 |
| 2013 | -- | $138,002 | $71,250 | $66,752 |
Source: Public Records
Map
Nearby Homes
- 1263 Leighton St
- 2529 Bora Ct
- 1301 Leighton St
- 2240 Peace Portal Dr Unit 5
- 1985 Bayview Ave
- 8055 Blaine Rd
- 1649 Bayview Ave
- 0 Shipyard Rd
- 1575 Kingsley Ave
- 750 Odell Rd
- 1384 Bayview Ct Unit E1
- 1301 Mitchell Ave
- 1428 Peace Portal Dr
- 1333 Harrison Ave
- 1260 Harrison Ave
- 1190 Blaine Ave
- 1300 Peace Portal Dr Unit 106
- 1273 4th St Unit 1 & 2
- 549 Cherry St
- 4255 West Rd