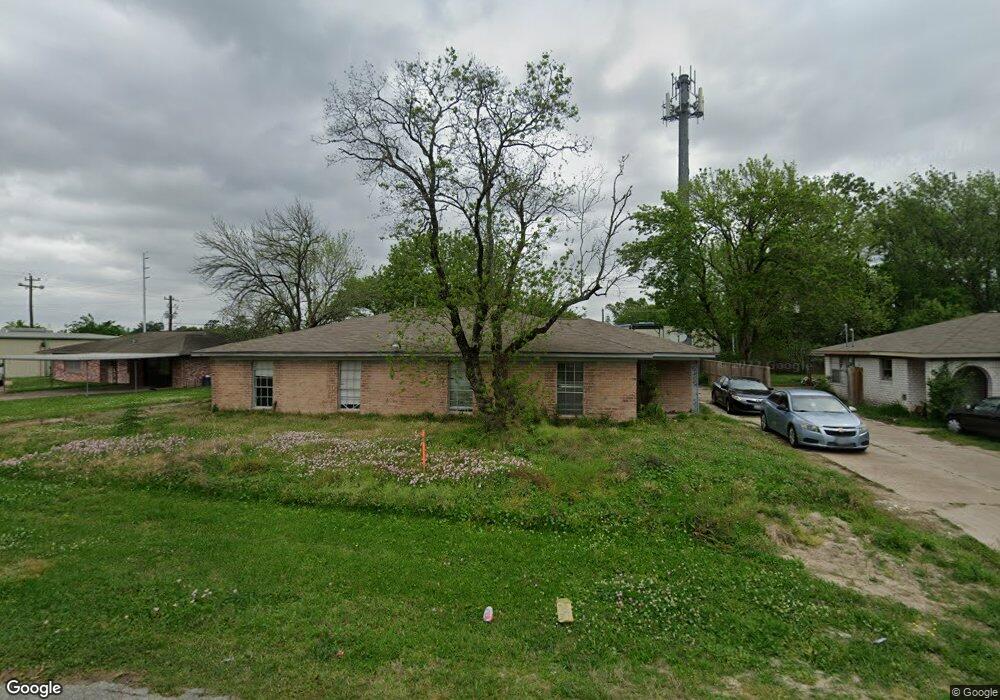
2411 Woodgate St Unit 1 Houston, TX 77039
East Aldine NeighborhoodEstimated Value: $296,714 - $518,000
3
Beds
2
Baths
2,364
Sq Ft
$163/Sq Ft
Est. Value
About This Home
This home is located at 2411 Woodgate St Unit 1, Houston, TX 77039 and is currently estimated at $384,929, approximately $162 per square foot. 2411 Woodgate St Unit 1 is a home located in Harris County with nearby schools including Hinojosa EC/PK/K, Raymond Academy, and Mead Middle.
Ownership History
Date
Name
Owned For
Owner Type
Purchase Details
Closed on
Feb 22, 2023
Sold by
Forrester Sharon
Bought by
Pandey Ajay
Current Estimated Value
Purchase Details
Closed on
Oct 10, 2018
Sold by
Montes Norma and Montes Jose E
Bought by
Camacho Rene
Purchase Details
Closed on
May 15, 2015
Sold by
Gershen Sam
Bought by
Montes Norma and Montes Jose E
Purchase Details
Closed on
Nov 4, 2010
Sold by
Nierman Jane and Nierman Steve
Bought by
Gershen Sam
Purchase Details
Closed on
Jul 28, 2006
Sold by
Jada Bassam Z and Jada Afaf B
Bought by
Nierman Steve and Nierman Jane
Home Financials for this Owner
Home Financials are based on the most recent Mortgage that was taken out on this home.
Original Mortgage
$148,050
Interest Rate
6.66%
Mortgage Type
Purchase Money Mortgage
Create a Home Valuation Report for This Property
The Home Valuation Report is an in-depth analysis detailing your home's value as well as a comparison with similar homes in the area
Home Values in the Area
Average Home Value in this Area
Purchase History
| Date | Buyer | Sale Price | Title Company |
|---|---|---|---|
| Pandey Ajay | -- | -- | |
| Camacho Rene | -- | Great American Title | |
| Montes Norma | -- | None Available | |
| Gershen Sam | -- | Startex Title Company 04 | |
| Nierman Steve | -- | United Title Of Texas |
Source: Public Records
Mortgage History
| Date | Status | Borrower | Loan Amount |
|---|---|---|---|
| Previous Owner | Nierman Steve | $148,050 |
Source: Public Records
Tax History Compared to Growth
Tax History
| Year | Tax Paid | Tax Assessment Tax Assessment Total Assessment is a certain percentage of the fair market value that is determined by local assessors to be the total taxable value of land and additions on the property. | Land | Improvement |
|---|---|---|---|---|
| 2025 | $5,779 | $279,904 | $51,707 | $228,197 |
| 2024 | $5,779 | $298,705 | $51,707 | $246,998 |
| 2023 | $5,779 | $298,705 | $51,707 | $246,998 |
| 2022 | $2,837 | $137,997 | $36,523 | $101,474 |
| 2021 | $2,238 | $103,822 | $17,877 | $85,945 |
| 2020 | $2,358 | $103,822 | $17,877 | $85,945 |
| 2019 | $2,470 | $103,822 | $17,877 | $85,945 |
| 2018 | $1,379 | $96,048 | $19,223 | $76,825 |
| 2017 | $2,419 | $106,724 | $19,223 | $87,501 |
| 2016 | $2,534 | $111,810 | $19,223 | $92,587 |
| 2015 | $1,492 | $0 | $0 | $0 |
| 2014 | $1,492 | $130,415 | $17,685 | $112,730 |
Source: Public Records
Map
Nearby Homes
- 2434 Balmorhea Ave
- 2438 Balmorhea Ave
- 2611 Lauder Rd
- 2703 Lauder Rd
- 2710 Woodgate St
- 2715 Toyah Ave
- 2807 Verhalen Ave
- 1810 Connorvale Rd
- 12123 Steeple Ln
- 0 Lauder Rd
- 13310 Robertcrest St Unit B
- 1720 Strawn Rd
- 1730 Strawn Rd
- 1826 Gault Rd
- 1916 Gault Rd
- 1725 Strawn Rd
- 1722 Strawn Rd
- 3503 Debeney Dr
- 2127 Maximilian St Unit 10
- 1631 Gault Rd
- 2411 Woodgate St
- 2413 Woodgate St
- 2417 Woodgate St
- 2407 Woodgate St
- 2410 Woodgate St
- 2414 Woodgate St
- 2406 Woodgate St
- 2422 Woodgate St
- 2422 Woodgate St
- 2402 Woodgate St
- 2425 Woodgate St
- 2409 Ridgeland Ave
- 2411 Ridgeland Ave
- 2430 Woodgate St
- 2415 Ridgeland Ave
- 2425 Lauder Rd
- 2433 Lauder Rd
- 13535 Russ Dr
- 2437 Lauder Rd
- 2443 Lauder Rd