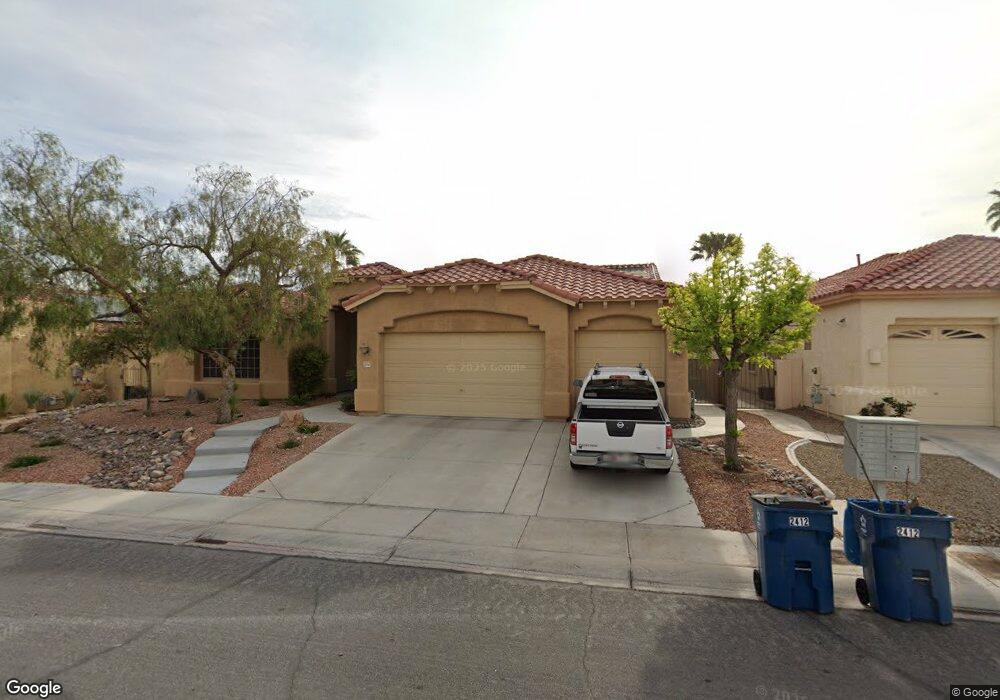
2412 Quartz Peak St Unit 2 Las Vegas, NV 89134
Summerlin NeighborhoodEstimated Value: $795,000 - $892,048
4
Beds
3
Baths
2,545
Sq Ft
$329/Sq Ft
Est. Value
About This Home
This home is located at 2412 Quartz Peak St Unit 2, Las Vegas, NV 89134 and is currently estimated at $837,012, approximately $328 per square foot. 2412 Quartz Peak St Unit 2 is a home located in Clark County with nearby schools including Ethel W. Staton Elementary School, Ernest Becker Middle School, and Palo Verde High School.
Ownership History
Date
Name
Owned For
Owner Type
Purchase Details
Closed on
Oct 9, 2014
Sold by
Huchmala Paul T and Huchmala Frances M
Bought by
Huchmala Family Trust
Current Estimated Value
Purchase Details
Closed on
Jul 22, 2002
Sold by
Gillett Jamie Lee and Gillett Arlene Susan
Bought by
Huchmala Paul T and Huchmala Frances M
Home Financials for this Owner
Home Financials are based on the most recent Mortgage that was taken out on this home.
Original Mortgage
$216,000
Outstanding Balance
$91,437
Interest Rate
6.69%
Estimated Equity
$745,575
Purchase Details
Closed on
Dec 30, 1996
Sold by
Pulte Home Corp
Bought by
Gillett Jamie Lee and Gillett Arlene Susan
Home Financials for this Owner
Home Financials are based on the most recent Mortgage that was taken out on this home.
Original Mortgage
$181,550
Interest Rate
7.59%
Create a Home Valuation Report for This Property
The Home Valuation Report is an in-depth analysis detailing your home's value as well as a comparison with similar homes in the area
Home Values in the Area
Average Home Value in this Area
Purchase History
| Date | Buyer | Sale Price | Title Company |
|---|---|---|---|
| Huchmala Family Trust | -- | None Available | |
| Huchmala Paul T | $270,000 | Land Title | |
| Gillett Jamie Lee | $227,000 | First American Title Co |
Source: Public Records
Mortgage History
| Date | Status | Borrower | Loan Amount |
|---|---|---|---|
| Open | Huchmala Paul T | $216,000 | |
| Previous Owner | Gillett Jamie Lee | $181,550 |
Source: Public Records
Tax History Compared to Growth
Tax History
| Year | Tax Paid | Tax Assessment Tax Assessment Total Assessment is a certain percentage of the fair market value that is determined by local assessors to be the total taxable value of land and additions on the property. | Land | Improvement |
|---|---|---|---|---|
| 2025 | $4,553 | $202,556 | $74,550 | $128,006 |
| 2024 | $4,421 | $202,556 | $74,550 | $128,006 |
| 2023 | $4,421 | $175,594 | $54,600 | $120,994 |
| 2022 | $4,295 | $165,696 | $54,600 | $111,096 |
| 2021 | $4,171 | $153,207 | $47,250 | $105,957 |
| 2020 | $4,046 | $146,517 | $41,300 | $105,217 |
| 2019 | $3,974 | $136,106 | $32,200 | $103,906 |
| 2018 | $3,858 | $131,269 | $30,800 | $100,469 |
| 2017 | $3,653 | $129,500 | $27,650 | $101,850 |
| 2016 | $3,653 | $131,181 | $26,600 | $104,581 |
| 2015 | $3,646 | $115,220 | $21,700 | $93,520 |
| 2014 | $3,539 | $104,549 | $21,875 | $82,674 |
Source: Public Records
Map
Nearby Homes
- 2333 Quartz Peak St
- 10208 Los Padres Place
- 10112 Plomosa Place
- 2505 Rocky Plains Dr
- 10301 Coal Creek Place
- 2513 Dark Peak Dr
- 10309 Georgetown Place
- 10309 Broom Hill Dr
- 10013 Cresent Creek Dr
- 10309 Marymont Place
- 2221 Grier Woods Ct
- 2413 Rockford St
- 9905 Sparrow Hawk Ct
- 10321 Marymont Place
- 10001 Cresent Creek Dr
- 10300 Linfield Place
- 2501 Maddington Dr
- 2216 Spring Water Dr
- 2401 Ocean Edge Ct
- 10413 Broom Hill Dr
- 2408 Quartz Peak St
- 2416 Quartz Peak St
- 2416 La Sierra St
- 2420 La Sierra St
- 2412 La Sierra St
- 2424 La Sierra St
- 2404 Quartz Peak St
- 2413 Quartz Peak St
- 2408 La Sierra St
- 2409 Quartz Peak St
- 10200 Angel Peak Ct
- 2404 La Sierra St
- 2405 Quartz Peak St
- 10144 Hill Country Ave
- 10136 Cypress Glen Ave
- 10137 Hill Country Ave
- 2400 Quartz Peak St
- 10204 Angel Peak Ct
- 10209 Angel Peak Ct
- 2400 La Sierra St