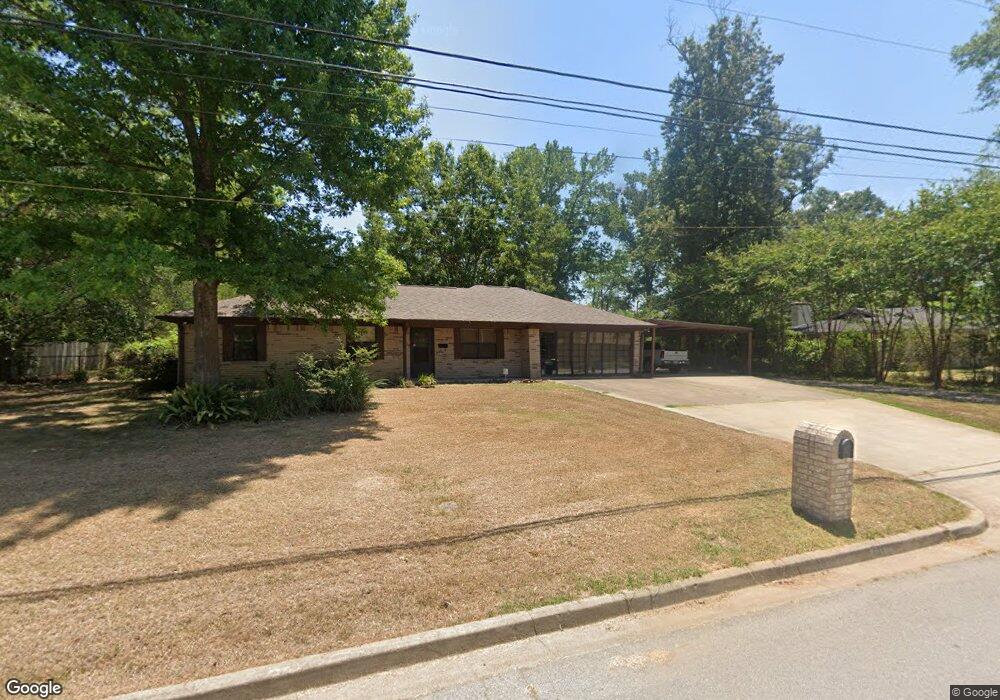
2412 Redbud St Kilgore, TX 75662
Estimated Value: $220,297 - $257,000
--
Bed
--
Bath
1,752
Sq Ft
$133/Sq Ft
Est. Value
About This Home
This home is located at 2412 Redbud St, Kilgore, TX 75662 and is currently estimated at $233,824, approximately $133 per square foot. 2412 Redbud St is a home located in Rusk County with nearby schools including Kilgore Primary School, Chandler Elementary School, and Kilgore Intermediate School.
Ownership History
Date
Name
Owned For
Owner Type
Purchase Details
Closed on
Jul 3, 2025
Sold by
Wolf Joe Ben
Bought by
Wolf Trenton A
Current Estimated Value
Home Financials for this Owner
Home Financials are based on the most recent Mortgage that was taken out on this home.
Original Mortgage
$121,300
Outstanding Balance
$121,096
Interest Rate
6.89%
Mortgage Type
New Conventional
Estimated Equity
$112,728
Purchase Details
Closed on
Jun 21, 2013
Sold by
The Nona Fay Bolt Family Trust No One
Bought by
Huff Loretta Gay
Purchase Details
Closed on
Feb 28, 2005
Sold by
Jarvis Ben E and Jarvis Mary S
Bought by
Carter Christopher Shane and Carter Beverly Raquel
Home Financials for this Owner
Home Financials are based on the most recent Mortgage that was taken out on this home.
Original Mortgage
$100,000
Interest Rate
5.78%
Create a Home Valuation Report for This Property
The Home Valuation Report is an in-depth analysis detailing your home's value as well as a comparison with similar homes in the area
Home Values in the Area
Average Home Value in this Area
Purchase History
| Date | Buyer | Sale Price | Title Company |
|---|---|---|---|
| Wolf Trenton A | -- | Chicago Title | |
| Wolf Trenton A | -- | Chicago Title | |
| Huff Loretta Gay | -- | None Available | |
| Carter Christopher Shane | -- | -- |
Source: Public Records
Mortgage History
| Date | Status | Borrower | Loan Amount |
|---|---|---|---|
| Open | Wolf Trenton A | $121,300 | |
| Closed | Wolf Trenton A | $121,300 | |
| Previous Owner | Carter Christopher Shane | $100,000 |
Source: Public Records
Tax History Compared to Growth
Tax History
| Year | Tax Paid | Tax Assessment Tax Assessment Total Assessment is a certain percentage of the fair market value that is determined by local assessors to be the total taxable value of land and additions on the property. | Land | Improvement |
|---|---|---|---|---|
| 2024 | $4,434 | $177,560 | $20,000 | $157,560 |
| 2023 | $4,026 | $163,650 | $20,000 | $143,650 |
| 2022 | $3,869 | $142,230 | $12,000 | $130,230 |
| 2021 | $3,009 | $118,470 | $12,000 | $106,470 |
| 2020 | $3,013 | $118,580 | $12,000 | $106,580 |
| 2019 | $3,348 | $128,510 | $12,000 | $116,510 |
| 2018 | $3,434 | $128,830 | $12,000 | $116,830 |
| 2017 | $3,276 | $129,010 | $12,000 | $117,010 |
| 2016 | $3,276 | $127,260 | $12,000 | $115,260 |
| 2015 | -- | $127,510 | $12,000 | $115,510 |
| 2014 | -- | $125,390 | $12,000 | $113,390 |
Source: Public Records
Map
Nearby Homes
- 1501 Remington Ct
- 1203 Penny Ln
- 2215 Redbud St
- 1404 Leach St
- 1616 Amanda Ln
- 1115 Roy St
- 1612 E Leach
- 2419 Broadway Blvd
- 908 Camp St
- 2509 Broadway Blvd
- 718 Bean Ave
- 3302 Forrest St
- 3360 Farm-To-market 1249
- 703 Monroe St
- 632 Leach St
- 2414 S Martin St
- 1218 Oak Dr
- 624 Camp St
- 1225 Oak Dr
- 2617 Florence St
- 2410 Redbud St
- tbd Redbud St
- 2500 Redbud St
- 2502 Redbud St
- 2408 Redbud St
- 2501 Redbud St
- 2411 Redbud St
- 2501 Chandler St
- 2503 Redbud St
- 2503 Chandler St
- 2407 Redbud St
- 2504 Redbud St
- 2406 Redbud St
- 2505 Redbud St
- 2505 Chandler St
- 2505 2505 Redbud St
- 2506 Redbud St
- 2507 Redbud St
- 2418 Clay St
- 2507 Chandler St