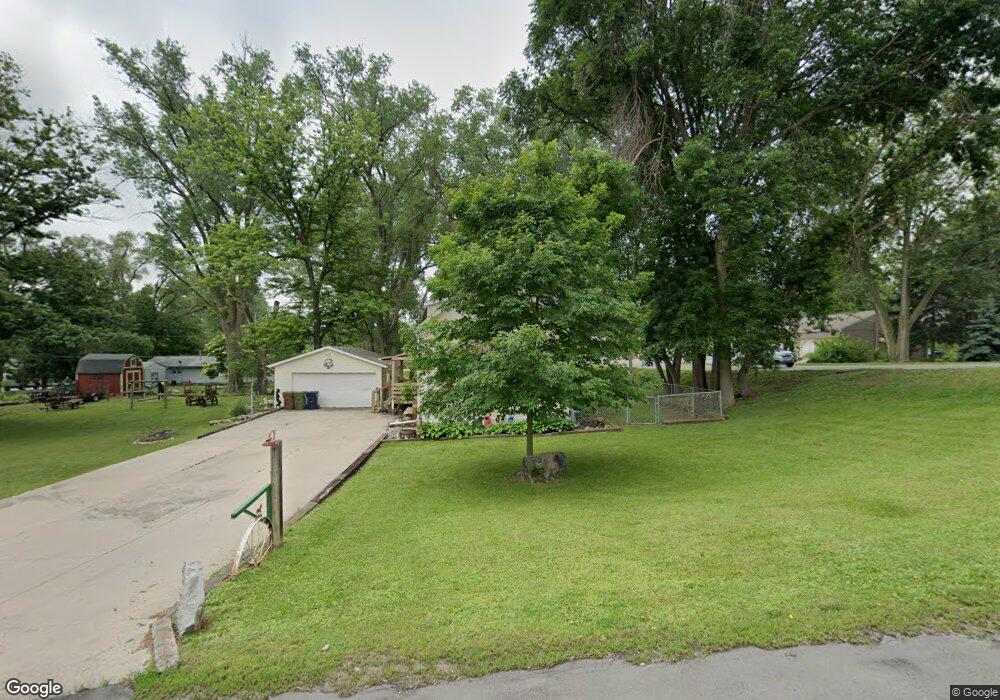
2413 Robin Dr Bellevue, NE 68147
Estimated Value: $261,000 - $372,000
3
Beds
2
Baths
1,613
Sq Ft
$181/Sq Ft
Est. Value
About This Home
This home is located at 2413 Robin Dr, Bellevue, NE 68147 and is currently estimated at $292,067, approximately $181 per square foot. 2413 Robin Dr is a home located in Sarpy County with nearby schools including Chandler View Elementary School, Bryan Middle School, and Bryan High School.
Ownership History
Date
Name
Owned For
Owner Type
Purchase Details
Closed on
Sep 13, 2011
Sold by
Tucker Matthew F and Tucker Janet K
Bought by
Harness Ronald C and Harnes Shanay M
Current Estimated Value
Home Financials for this Owner
Home Financials are based on the most recent Mortgage that was taken out on this home.
Original Mortgage
$138,400
Outstanding Balance
$94,026
Interest Rate
4.4%
Mortgage Type
FHA
Estimated Equity
$198,041
Purchase Details
Closed on
Oct 11, 2007
Sold by
Morgan Brandon C and Morgan Amanda S
Bought by
Tucker Matthew F and Tucker Janet K
Home Financials for this Owner
Home Financials are based on the most recent Mortgage that was taken out on this home.
Original Mortgage
$137,902
Interest Rate
6.32%
Mortgage Type
VA
Purchase Details
Closed on
Jul 28, 2004
Sold by
Minor Cecil and Minor Olivia
Bought by
Morgan Brandon C and Morgan Amanda S
Home Financials for this Owner
Home Financials are based on the most recent Mortgage that was taken out on this home.
Original Mortgage
$91,350
Interest Rate
6.26%
Mortgage Type
Purchase Money Mortgage
Purchase Details
Closed on
Nov 4, 2000
Sold by
Minor Jeanette
Bought by
Minor Cecil L
Create a Home Valuation Report for This Property
The Home Valuation Report is an in-depth analysis detailing your home's value as well as a comparison with similar homes in the area
Home Values in the Area
Average Home Value in this Area
Purchase History
| Date | Buyer | Sale Price | Title Company |
|---|---|---|---|
| Harness Ronald C | $142,000 | Omaha Title & Escrow Inc | |
| Tucker Matthew F | $135,000 | Fat | |
| Morgan Brandon C | $102,000 | -- | |
| Minor Cecil L | -- | -- |
Source: Public Records
Mortgage History
| Date | Status | Borrower | Loan Amount |
|---|---|---|---|
| Open | Harness Ronald C | $138,400 | |
| Closed | Tucker Matthew F | $137,902 | |
| Closed | Morgan Brandon C | $91,350 |
Source: Public Records
Tax History
| Year | Tax Paid | Tax Assessment Tax Assessment Total Assessment is a certain percentage of the fair market value that is determined by local assessors to be the total taxable value of land and additions on the property. | Land | Improvement |
|---|---|---|---|---|
| 2025 | $3,713 | $242,530 | $35,000 | $207,530 |
| 2024 | $3,713 | $220,935 | $35,000 | $185,935 |
| 2023 | $4,555 | $210,996 | $35,000 | $175,996 |
| 2022 | $4,260 | $195,146 | $35,000 | $160,146 |
| 2021 | $3,833 | $174,464 | $30,000 | $144,464 |
| 2020 | $3,585 | $162,077 | $30,000 | $132,077 |
| 2019 | $3,237 | $146,115 | $30,000 | $116,115 |
| 2018 | $2,601 | $143,866 | $30,000 | $113,866 |
| 2017 | $2,383 | $130,730 | $30,000 | $100,730 |
| 2016 | $2,303 | $127,350 | $30,000 | $97,350 |
| 2015 | $2,300 | $130,836 | $38,000 | $92,836 |
| 2014 | $2,217 | $127,420 | $30,000 | $97,420 |
| 2012 | -- | $131,276 | $30,000 | $101,276 |
Source: Public Records
Map
Nearby Homes
- 2513 Cornelia St
- 8688 S 23rd St
- 2605 Virginia St
- 2206 Citta Cir
- 8706 S 23rd St
- 8710 S 23rd St
- 2201 Citta Cir
- 2205 Citta Cir
- 8714 S 23rd St
- 8711 S 23rd St
- 8715 S 23rd St
- 2616 Rose Lane Rd
- 2455 Rose Lane Rd
- 2034 Concord Cir
- 2529 Mose Ave Unit 9A
- 8816 S 23rd St
- 2030 Concord Cir
- 2026 Concord Cir
- 2022 Concord Cir
- 2018 Concord Cir
- 2406 Childs Rd W
- 2410 Robin Dr
- 2401 Robin Dr
- 8205 S 25th St
- 2328 Childs Rd W
- 2402 Robin Dr
- 2309 Robin Dr
- 2320 Childs Rd W
- 8224 S 25th St
- 2310 Robin Dr
- 8700 S 25th St
- 2305 Robin Dr
- 8201 S 25th St
- 8230 S 25th St
- 2316 Childs Rd W
- 2506 Childs Rd W
- 2509 Linda St
- 8303 S 25th St
- 2501 Childs Rd W
- 2306 Robin Dr
Your Personal Tour Guide
Ask me questions while you tour the home.