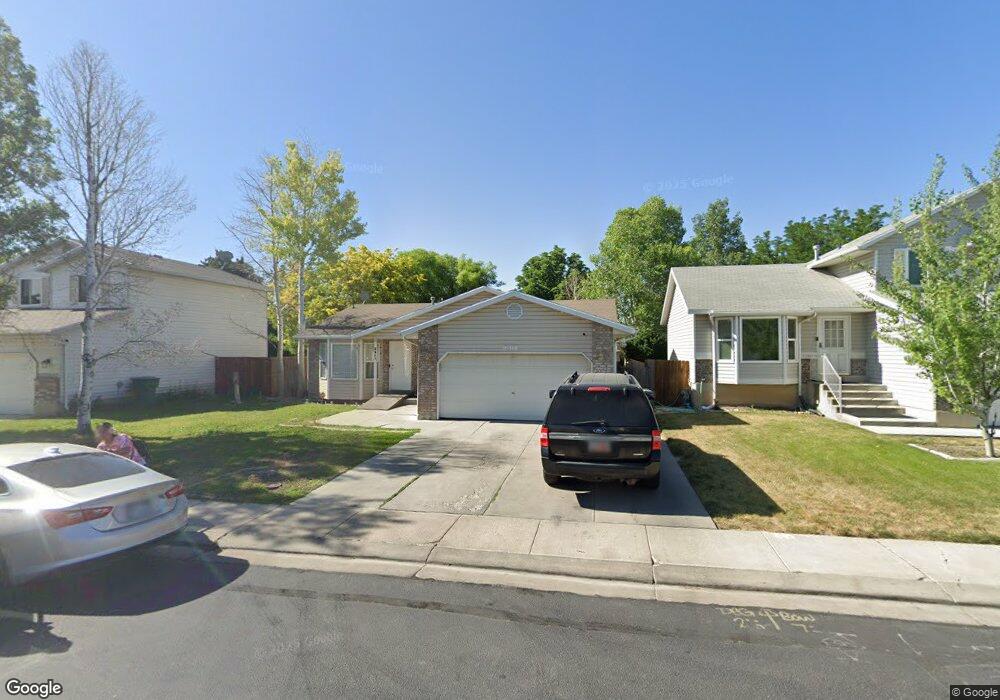
2413 Sugar Place West Jordan, UT 84088
Estimated Value: $496,000 - $584,000
4
Beds
3
Baths
2,216
Sq Ft
$243/Sq Ft
Est. Value
About This Home
This home is located at 2413 Sugar Place, West Jordan, UT 84088 and is currently estimated at $537,517, approximately $242 per square foot. 2413 Sugar Place is a home located in Salt Lake County with nearby schools including Westvale Elementary School, West Jordan Middle School, and West Jordan High School.
Ownership History
Date
Name
Owned For
Owner Type
Purchase Details
Closed on
Sep 22, 2015
Sold by
Tyler Kim L
Bought by
Lin Qiuwei
Current Estimated Value
Home Financials for this Owner
Home Financials are based on the most recent Mortgage that was taken out on this home.
Original Mortgage
$145,600
Outstanding Balance
$111,718
Interest Rate
3.25%
Mortgage Type
Adjustable Rate Mortgage/ARM
Estimated Equity
$425,799
Purchase Details
Closed on
Nov 14, 2006
Sold by
Gray Kirk R and Gray Jennifer E
Bought by
Tyler Kim L
Home Financials for this Owner
Home Financials are based on the most recent Mortgage that was taken out on this home.
Original Mortgage
$199,120
Interest Rate
6.28%
Mortgage Type
Stand Alone First
Purchase Details
Closed on
Apr 2, 1997
Sold by
Long J Stratton and Long Patricia A
Bought by
Gray Kirk R and Gray Jennifer E
Home Financials for this Owner
Home Financials are based on the most recent Mortgage that was taken out on this home.
Original Mortgage
$148,614
Interest Rate
8%
Mortgage Type
VA
Create a Home Valuation Report for This Property
The Home Valuation Report is an in-depth analysis detailing your home's value as well as a comparison with similar homes in the area
Home Values in the Area
Average Home Value in this Area
Purchase History
| Date | Buyer | Sale Price | Title Company |
|---|---|---|---|
| Lin Qiuwei | -- | Bonneville Superior Title | |
| Tyler Kim L | -- | None Available | |
| Gray Kirk R | -- | -- |
Source: Public Records
Mortgage History
| Date | Status | Borrower | Loan Amount |
|---|---|---|---|
| Open | Lin Qiuwei | $145,600 | |
| Previous Owner | Tyler Kim L | $199,120 | |
| Previous Owner | Gray Kirk R | $148,614 |
Source: Public Records
Tax History Compared to Growth
Tax History
| Year | Tax Paid | Tax Assessment Tax Assessment Total Assessment is a certain percentage of the fair market value that is determined by local assessors to be the total taxable value of land and additions on the property. | Land | Improvement |
|---|---|---|---|---|
| 2025 | -- | $504,000 | $137,000 | $367,000 |
| 2024 | -- | $465,300 | $126,400 | $338,900 |
| 2023 | $2,450 | $444,300 | $119,200 | $325,100 |
| 2022 | $2,539 | $453,000 | $116,900 | $336,100 |
| 2021 | $2,137 | $347,000 | $94,300 | $252,700 |
| 2020 | $2,020 | $307,800 | $94,300 | $213,500 |
| 2019 | $1,944 | $290,500 | $94,300 | $196,200 |
| 2018 | $1,826 | $270,600 | $69,100 | $201,500 |
| 2017 | $1,706 | $251,800 | $69,100 | $182,700 |
| 2016 | $1,662 | $230,400 | $69,100 | $161,300 |
| 2015 | -- | $212,900 | $72,400 | $140,500 |
| 2014 | $1,470 | $195,600 | $67,100 | $128,500 |
Source: Public Records
Map
Nearby Homes
- 2497 Bueno Vista Dr
- 8026 Laguna Cir
- 8140 S 2245 W
- 48 San Rafael Ct
- 14 San Miguel St
- 7968 S 2700 W
- 77 Rio Bravo Place
- 7993 S 2760 W
- 8383 S 2200 W
- 8461 S 2385 W
- 7942 S 2800 W
- 2386 W 7680 S
- 7987 S 2980 W
- 7647 S 2500 W
- 1790 W Sugar Factory Rd
- 2062 W 7705 S
- 8407 Meadow Green Way
- 4000 W 8400 S Unit 83
- 2169 W 7600 S
- 7642 S 2700 W
- 2413 W Sugar Place
- 2403 W Sugar Place
- 2403 Sugar Place
- 2423 Sugar Place
- 2416 Pauline Way
- 2406 Pauline Way
- 2428 W Pauline Way
- 2428 Pauline Way
- 2391 Sugar Place
- 2433 Sugar Place
- 2438 Pauline Way
- 2438 W Pauline Way
- 2392 W Pauline Way
- 2392 Pauline Way
- 2412 Sugar Place
- 2412 W Sugar Place
- 2381 Sugar Place
- 2445 Sugar Place
- 2445 W Sugar Place
- 2428 Sugar Place