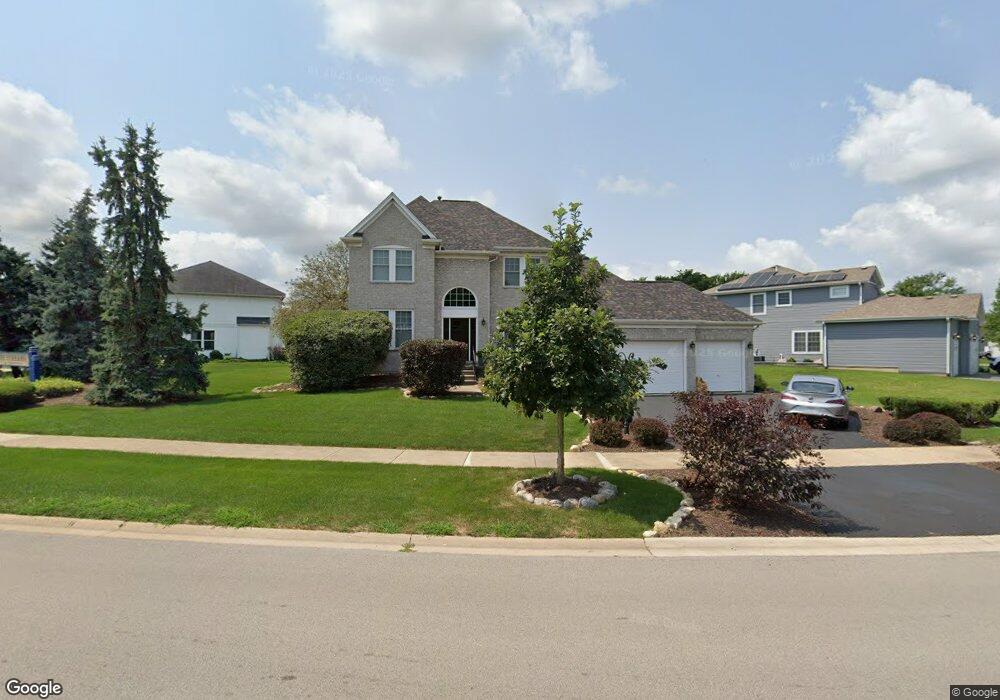
24135 Apple Creek Ln Plainfield, IL 60586
East Plainfield NeighborhoodEstimated Value: $498,000 - $522,000
5
Beds
4
Baths
3,300
Sq Ft
$156/Sq Ft
Est. Value
About This Home
This home is located at 24135 Apple Creek Ln, Plainfield, IL 60586 and is currently estimated at $513,905, approximately $155 per square foot. 24135 Apple Creek Ln is a home located in Will County with nearby schools including River View Elementary School, Timber Ridge Middle School, and Plainfield Central High School.
Ownership History
Date
Name
Owned For
Owner Type
Purchase Details
Closed on
Oct 23, 2024
Sold by
Mangino Gary J
Bought by
Mangino Gary J and Mangino Colleen
Current Estimated Value
Purchase Details
Closed on
Jan 7, 2008
Sold by
Obrien Michael E and Obrien Kristen L
Bought by
Mangino Gary J
Home Financials for this Owner
Home Financials are based on the most recent Mortgage that was taken out on this home.
Original Mortgage
$277,400
Interest Rate
6.13%
Mortgage Type
Purchase Money Mortgage
Purchase Details
Closed on
Jul 25, 2003
Sold by
The Streams Llc
Bought by
Kristen Michael E and Obrien Krsiten L
Home Financials for this Owner
Home Financials are based on the most recent Mortgage that was taken out on this home.
Original Mortgage
$270,000
Interest Rate
7.49%
Mortgage Type
Purchase Money Mortgage
Create a Home Valuation Report for This Property
The Home Valuation Report is an in-depth analysis detailing your home's value as well as a comparison with similar homes in the area
Home Values in the Area
Average Home Value in this Area
Purchase History
| Date | Buyer | Sale Price | Title Company |
|---|---|---|---|
| Mangino Gary J | -- | None Listed On Document | |
| Mangino Gary J | $292,000 | Multiple | |
| Kristen Michael E | $346,000 | First American Title |
Source: Public Records
Mortgage History
| Date | Status | Borrower | Loan Amount |
|---|---|---|---|
| Previous Owner | Mangino Gary J | $277,400 | |
| Previous Owner | Kristen Michael E | $270,000 |
Source: Public Records
Tax History Compared to Growth
Tax History
| Year | Tax Paid | Tax Assessment Tax Assessment Total Assessment is a certain percentage of the fair market value that is determined by local assessors to be the total taxable value of land and additions on the property. | Land | Improvement |
|---|---|---|---|---|
| 2024 | $9,543 | $137,447 | $27,973 | $109,474 |
| 2023 | $9,543 | $124,140 | $25,265 | $98,875 |
| 2022 | $8,563 | $111,494 | $22,691 | $88,803 |
| 2021 | $8,085 | $104,200 | $21,207 | $82,993 |
| 2020 | $7,968 | $101,243 | $20,605 | $80,638 |
| 2019 | $7,684 | $96,468 | $19,633 | $76,835 |
| 2018 | $7,039 | $87,199 | $18,447 | $68,752 |
| 2017 | $6,816 | $82,865 | $17,530 | $65,335 |
| 2016 | $6,643 | $79,032 | $16,719 | $62,313 |
| 2015 | $6,269 | $74,035 | $15,662 | $58,373 |
| 2014 | $6,269 | $71,421 | $15,109 | $56,312 |
| 2013 | $6,269 | $71,421 | $15,109 | $56,312 |
Source: Public Records
Map
Nearby Homes
- 00000 Dayfield Dr
- 0000 Dayfield Dr
- 000000 Dayfield Dr
- 0 Dayfield Dr Unit MRD11616300
- 16320 Spring Creek Ln
- 23901 Cahills Way
- 23911 Mc Mullin Cir Unit 622
- 23736 Dayfield Ct
- 0007 Illinois Route 59
- 0003 Illinois Route 59
- 0009 Illinois Route 59
- 0005 Illinois Route 59
- 0006 Illinois Route 59
- 16040 S Arbor Dr
- 16062 S Lexington Dr
- 23545 W Rueben St
- 2731 Old Woods Trail Unit 9C
- 23538 W Rueben St Unit 6
- 24811 Petit Ct
- 24817 Petit Ct
- 24137 Apple Creek Ln
- 24142 Mill Creek Ln
- 24145 Apple Creek Ln
- 24146 Mill Creek Ln
- 24134 Apple Creek Ln
- 24136 Apple Creek Ln
- 24150 Mill Creek Ln
- 24138 Apple Creek Ln
- 24153 Apple Creek Ln
- 00 Dayfield Dr
- 000 Dayfield Dr
- 0 Dayfield Dr Unit 8599434
- 0 Dayfield Dr Unit 8826197
- 24139 Mill Creek Ln
- 24140 Apple Creek Ln
- 24144 Apple Creek Ln
- 24154 Mill Creek Ln
- 24157 Apple Creek Ln
- 16641 Silver Creek Ct
- 24148 Apple Creek Ln