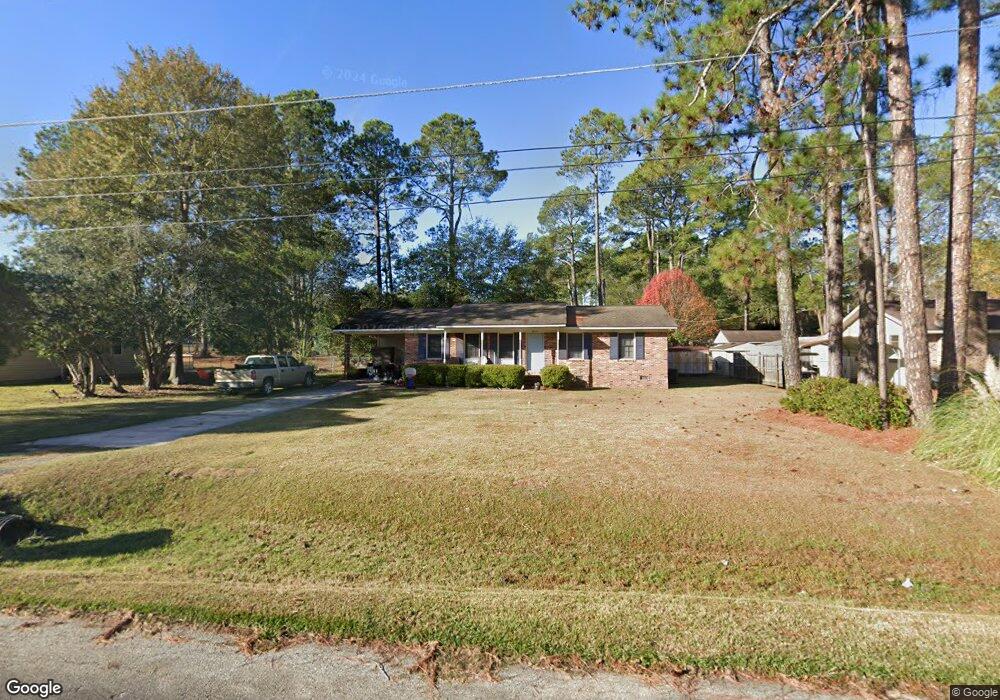
2414 Lee Ave Tifton, GA 31794
Estimated Value: $161,000 - $201,021
3
Beds
2
Baths
1,250
Sq Ft
$145/Sq Ft
Est. Value
About This Home
This home is located at 2414 Lee Ave, Tifton, GA 31794 and is currently estimated at $181,505, approximately $145 per square foot. 2414 Lee Ave is a home located in Tift County with nearby schools including Northside Primary School, Charles Spencer Elementary School, and J.T. Reddick School.
Ownership History
Date
Name
Owned For
Owner Type
Purchase Details
Closed on
Jul 15, 2019
Sold by
229 Properties Llc
Bought by
Spells Megan Elaine
Current Estimated Value
Home Financials for this Owner
Home Financials are based on the most recent Mortgage that was taken out on this home.
Original Mortgage
$112,575
Outstanding Balance
$98,626
Interest Rate
3.82%
Mortgage Type
New Conventional
Estimated Equity
$82,879
Purchase Details
Closed on
Nov 1, 2017
Sold by
Blankenship Tynes Kathy
Bought by
229 Properties Llc
Home Financials for this Owner
Home Financials are based on the most recent Mortgage that was taken out on this home.
Original Mortgage
$56,637
Interest Rate
3.85%
Mortgage Type
Mortgage Modification
Purchase Details
Closed on
Apr 9, 1992
Sold by
Markham Rosalinda M
Bought by
Tynes Kathy Blankenship
Purchase Details
Closed on
Mar 3, 1989
Sold by
Holley Aubrey Gene and Holley Nancy
Bought by
Markham Rosalinda M
Purchase Details
Closed on
Oct 13, 1983
Sold by
Barfield Larry R
Bought by
Holley Aubrey Gene
Create a Home Valuation Report for This Property
The Home Valuation Report is an in-depth analysis detailing your home's value as well as a comparison with similar homes in the area
Home Values in the Area
Average Home Value in this Area
Purchase History
| Date | Buyer | Sale Price | Title Company |
|---|---|---|---|
| Spells Megan Elaine | $118,500 | -- | |
| 229 Properties Llc | $65,000 | -- | |
| Tynes Kathy Blankenship | $44,000 | -- | |
| Markham Rosalinda M | $48,800 | -- | |
| Holley Aubrey Gene | $34,000 | -- |
Source: Public Records
Mortgage History
| Date | Status | Borrower | Loan Amount |
|---|---|---|---|
| Open | Spells Megan Elaine | $112,575 | |
| Previous Owner | 229 Properties Llc | $56,637 |
Source: Public Records
Tax History Compared to Growth
Tax History
| Year | Tax Paid | Tax Assessment Tax Assessment Total Assessment is a certain percentage of the fair market value that is determined by local assessors to be the total taxable value of land and additions on the property. | Land | Improvement |
|---|---|---|---|---|
| 2024 | $1,212 | $44,960 | $8,400 | $36,560 |
| 2023 | $1,289 | $29,580 | $4,000 | $25,580 |
| 2022 | $1,115 | $29,620 | $4,000 | $25,620 |
| 2021 | $1,122 | $29,620 | $4,000 | $25,620 |
| 2020 | $1,131 | $29,128 | $4,000 | $25,128 |
| 2019 | $1,131 | $29,128 | $4,000 | $25,128 |
| 2018 | $1,010 | $29,128 | $4,000 | $25,128 |
| 2017 | $1,003 | $29,128 | $4,000 | $25,128 |
| 2016 | $1,005 | $29,128 | $4,000 | $25,128 |
| 2015 | $1,006 | $29,128 | $4,000 | $25,128 |
| 2014 | $1,007 | $29,128 | $4,000 | $25,128 |
| 2013 | -- | $29,128 | $4,000 | $25,128 |
Source: Public Records
Map
Nearby Homes
- 2417 Belmont Ave
- 2411 Davis Ave
- 2612 Goff St
- 2021 Davis Ave
- 2020 Davis Ave
- 705 20th St E
- 1809 Davis Ave
- 502 20th St E
- 0 Old Ocilla Rd Unit 138781
- 0 Old Ocilla Rd Unit 10611000
- -0- Old Ocilla Rd
- 903 42nd St E
- 0 44th St E
- 2214 Love Ave
- 714 44th St E
- 717 E 44th St
- 4204 Lakeview Dr
- 0 E 46th St
- 913 E 46th St
- 0 Tift Ave