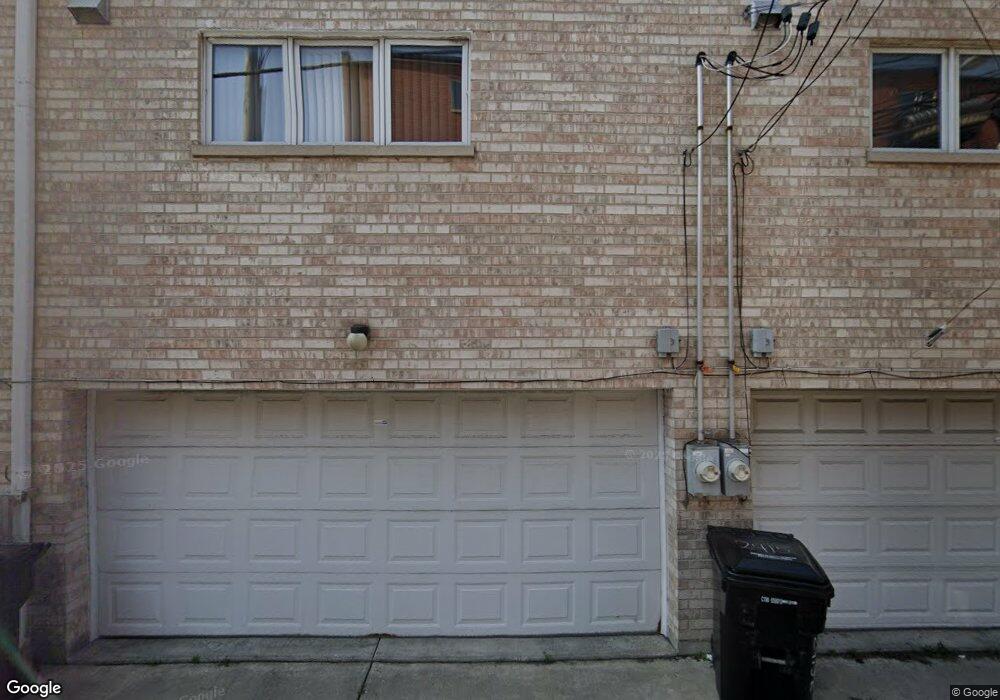
2415 S Normal Ave Chicago, IL 60616
Chinatown NeighborhoodEstimated Value: $432,141 - $529,000
3
Beds
3
Baths
1,656
Sq Ft
$291/Sq Ft
Est. Value
About This Home
This home is located at 2415 S Normal Ave, Chicago, IL 60616 and is currently estimated at $481,535, approximately $290 per square foot. 2415 S Normal Ave is a home located in Cook County with nearby schools including Healy Elementary School, Village Leadership Academy, and Ryan Banks Academy.
Ownership History
Date
Name
Owned For
Owner Type
Purchase Details
Closed on
Apr 12, 2007
Sold by
Shi Jiang
Bought by
Shi Jiang and Wang Xin
Current Estimated Value
Purchase Details
Closed on
Jun 30, 2005
Sold by
Dai Sey Way and Dai Hong Ying
Bought by
Shi Jiang
Home Financials for this Owner
Home Financials are based on the most recent Mortgage that was taken out on this home.
Original Mortgage
$32,800
Outstanding Balance
$16,706
Interest Rate
5.68%
Mortgage Type
Credit Line Revolving
Estimated Equity
$464,829
Purchase Details
Closed on
Aug 15, 1997
Sold by
Dai Richard
Bought by
Dai Sey Way and Dai Hong Ying
Purchase Details
Closed on
Dec 15, 1995
Sold by
Lakeside Bank
Bought by
Dai Richard
Home Financials for this Owner
Home Financials are based on the most recent Mortgage that was taken out on this home.
Original Mortgage
$100,000
Interest Rate
7.36%
Create a Home Valuation Report for This Property
The Home Valuation Report is an in-depth analysis detailing your home's value as well as a comparison with similar homes in the area
Home Values in the Area
Average Home Value in this Area
Purchase History
| Date | Buyer | Sale Price | Title Company |
|---|---|---|---|
| Shi Jiang | -- | None Available | |
| Shi Jiang | $328,000 | First American Title Ins Co | |
| Dai Sey Way | -- | Chicago Title Insurance Co | |
| Dai Richard | $180,000 | -- |
Source: Public Records
Mortgage History
| Date | Status | Borrower | Loan Amount |
|---|---|---|---|
| Open | Shi Jiang | $32,800 | |
| Previous Owner | Dai Richard | $100,000 |
Source: Public Records
Tax History
| Year | Tax Paid | Tax Assessment Tax Assessment Total Assessment is a certain percentage of the fair market value that is determined by local assessors to be the total taxable value of land and additions on the property. | Land | Improvement |
|---|---|---|---|---|
| 2025 | $7,107 | $48,000 | $6,431 | $41,569 |
| 2024 | $7,107 | $48,000 | $6,431 | $41,569 |
| 2023 | $6,907 | $37,000 | $5,192 | $31,808 |
| 2022 | $6,907 | $37,000 | $5,192 | $31,808 |
| 2021 | $6,771 | $37,000 | $5,192 | $31,808 |
| 2020 | $6,963 | $34,360 | $5,192 | $29,168 |
| 2019 | $7,068 | $38,607 | $5,192 | $33,415 |
| 2018 | $6,948 | $38,607 | $5,192 | $33,415 |
| 2017 | $7,508 | $34,878 | $4,130 | $30,748 |
| 2016 | $6,986 | $34,878 | $4,130 | $30,748 |
| 2015 | $6,391 | $34,878 | $4,130 | $30,748 |
| 2014 | $5,587 | $30,115 | $3,540 | $26,575 |
| 2013 | $5,477 | $30,115 | $3,540 | $26,575 |
Source: Public Records
Map
Nearby Homes
- 2415 S Normal Ave Unit F
- 318 W 24th Place
- 335 W 23rd St Unit B
- 266 W 24th Place Unit 2
- 2615 S Lowe Ave Unit 1S
- 1730 S Union Ave
- 2625 S Union Ave
- 2567 S Emerald Ave
- 2631 S Shields Ave
- 2828 S Emerald Ave
- 2734 S Wentworth Ave Unit PS38
- 2738 S Wentworth Ave Unit 2F
- 2935 S Emerald Ave
- 2925 S Shields Ave
- 2843 S Wells St Unit 1E
- 1901 S Ruble St
- 2545 S Dearborn St Unit P-56
- 2545 S Dearborn St Unit 606
- 2545 S Dearborn St Unit P-91
- 2545 S Dearborn St Unit 309
- 2415 S Normal Ave
- 2415 S Normal Ave
- 2415 S Normal Ave
- 2415 S Normal Ave
- 2415 S Normal Ave
- 2415 S Normal Ave
- 2415 S Normal Ave
- 2415 S Normal Ave
- 2415 S Normal Ave
- 2415 S Normal Ave
- 2415 S Normal Ave Unit A
- 2415 S Normal Ave Unit E
- 2415 S Normal Ave Unit G
- 2423 S Normal Ave
- 2423 S Normal Ave
- 2423 S Normal Ave
- 2423 S Normal Ave
- 2423 S Normal Ave
- 2423 S Normal Ave
- 2423 S Normal Ave
Your Personal Tour Guide
Ask me questions while you tour the home.