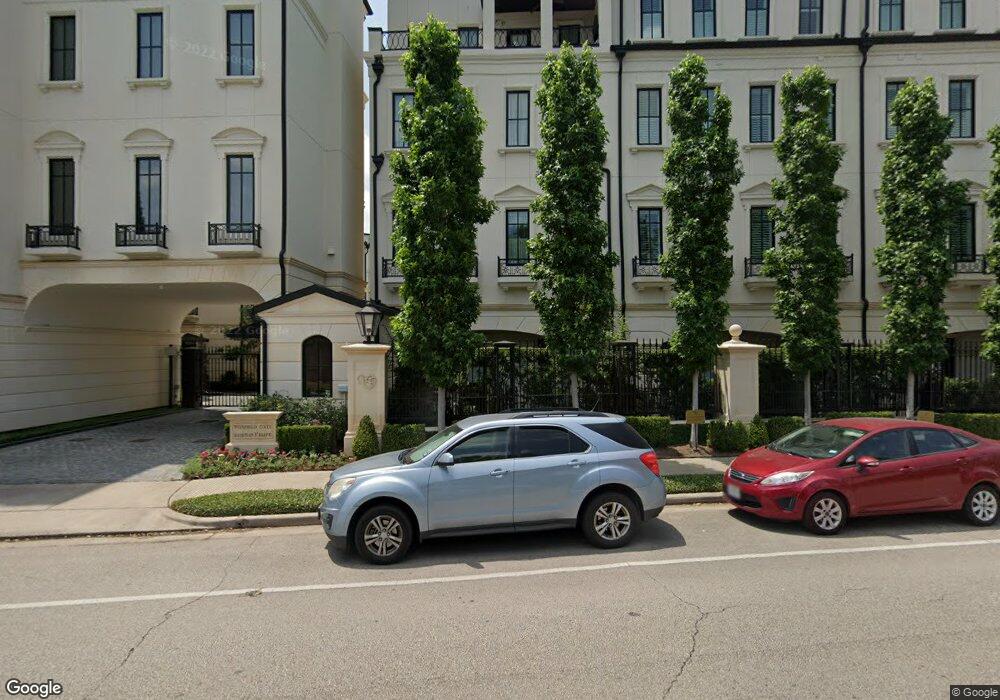
2415 San Felipe St Unit 8 Houston, TX 77019
River Oaks NeighborhoodEstimated Value: $1,635,240 - $1,970,000
4
Beds
6
Baths
4,256
Sq Ft
$436/Sq Ft
Est. Value
About This Home
This home is located at 2415 San Felipe St Unit 8, Houston, TX 77019 and is currently estimated at $1,857,060, approximately $436 per square foot. 2415 San Felipe St Unit 8 is a home located in Harris County with nearby schools including River Oaks Elementary School, Lanier Middle School, and Lamar High School.
Ownership History
Date
Name
Owned For
Owner Type
Purchase Details
Closed on
Jul 28, 2015
Sold by
Gate Partners Llc
Bought by
Robidoux Marko William A and Robidoux Marko Marta
Current Estimated Value
Home Financials for this Owner
Home Financials are based on the most recent Mortgage that was taken out on this home.
Original Mortgage
$1,276,000
Outstanding Balance
$1,005,270
Interest Rate
4.08%
Mortgage Type
Purchase Money Mortgage
Estimated Equity
$851,790
Purchase Details
Closed on
Jun 29, 2007
Sold by
Willis Real Estate Investments Llc
Bought by
Crane/Willis Properties Llc
Home Financials for this Owner
Home Financials are based on the most recent Mortgage that was taken out on this home.
Original Mortgage
$2,430,000
Interest Rate
6.71%
Mortgage Type
Purchase Money Mortgage
Create a Home Valuation Report for This Property
The Home Valuation Report is an in-depth analysis detailing your home's value as well as a comparison with similar homes in the area
Home Values in the Area
Average Home Value in this Area
Purchase History
| Date | Buyer | Sale Price | Title Company |
|---|---|---|---|
| Robidoux Marko William A | -- | Veritas Title Partners | |
| Crane/Willis Properties Llc | -- | Houston Title Co |
Source: Public Records
Mortgage History
| Date | Status | Borrower | Loan Amount |
|---|---|---|---|
| Open | Robidoux Marko William A | $1,276,000 | |
| Previous Owner | Crane/Willis Properties Llc | $2,430,000 |
Source: Public Records
Tax History Compared to Growth
Tax History
| Year | Tax Paid | Tax Assessment Tax Assessment Total Assessment is a certain percentage of the fair market value that is determined by local assessors to be the total taxable value of land and additions on the property. | Land | Improvement |
|---|---|---|---|---|
| 2025 | $25,066 | $1,510,649 | $322,625 | $1,188,024 |
| 2024 | $25,066 | $1,652,786 | $322,625 | $1,330,161 |
| 2023 | $25,066 | $1,711,750 | $322,625 | $1,389,125 |
| 2022 | $33,887 | $1,539,013 | $232,290 | $1,306,723 |
| 2021 | $33,611 | $1,442,140 | $232,290 | $1,209,850 |
| 2020 | $36,175 | $1,493,855 | $232,290 | $1,261,565 |
| 2019 | $41,879 | $1,655,000 | $232,290 | $1,422,710 |
| 2018 | $33,369 | $1,655,080 | $209,061 | $1,446,019 |
| 2017 | $41,850 | $1,655,080 | $209,061 | $1,446,019 |
| 2016 | $41,850 | $1,655,080 | $209,061 | $1,446,019 |
| 2015 | $9,790 | $767,585 | $181,186 | $586,399 |
| 2014 | $9,790 | $380,848 | $181,186 | $199,662 |
Source: Public Records
Map
Nearby Homes
- 2103 Argonne St Unit B
- 2336 Welch St
- 1913 Revere St
- 1915 Kirby Dr
- 2419 Mimosa Dr Unit 601
- 2419 Mimosa Dr Unit 801
- 2419 Mimosa Dr Unit 603
- 2323 San Felipe St Unit 901
- 2323 San Felipe St Unit 1101
- 2323 San Felipe St Unit 602
- 2413 Mimosa Dr
- 2121 Kirby Dr Unit 12N
- 2240 Mimosa Dr Unit 4W
- 2240 Mimosa Dr Unit 4N
- 2240 Mimosa Dr Unit PH-8W
- 2240 Mimosa Dr Unit 6W
- 2240 Mimosa Dr Unit 5W
- 2240 Mimosa Dr Unit 3N
- 2240 Mimosa Dr Unit 6E
- 2240 Mimosa Dr Unit PH-7E
- 2415 San Felipe St
- 2415 San Felipe St Unit 5
- 2415 San Felipe St Unit 4
- 2415 San Felipe St Unit 2
- 2415 San Felipe St Unit 3
- 2415 San Felipe St Unit 13
- 2415 San Felipe St Unit 15
- 2415 San Felipe St Unit 11
- 2415 San Felipe St Unit 9
- 2415 San Felipe St Unit 10
- 2415 San Felipe St Unit 14
- 2415 San Felipe St Unit 1
- 2415 San Felipe St Unit 18
- 2415 San Felipe St Unit 20
- 2415 San Felipe St Unit 19
- 2415 San Felipe St Unit 22
- 2415 San Felipe St Unit 21
- 2413 San Felipe St
- 2411 San Felipe St
- 2422 Brazoria St