Estimated Value: $242,000 - $252,000
3
Beds
2
Baths
1,836
Sq Ft
$134/Sq Ft
Est. Value
About This Home
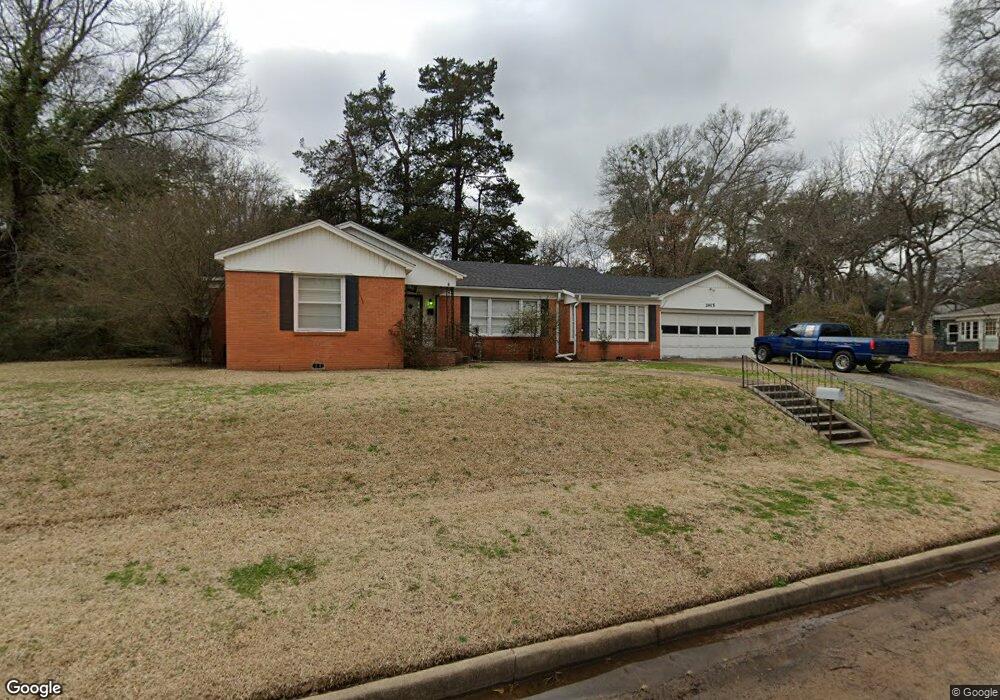
This home is located at 2415 Sunnybrook Dr, Tyler, TX 75701 and is currently estimated at $246,547, approximately $134 per square foot. 2415 Sunnybrook Dr is a home located in Smith County with nearby schools including Birdwell Dual Language Immersion School, Hogg Middle School, and Tyler Legacy High School.
Ownership History
Date
Name
Owned For
Owner Type
Purchase Details
Closed on
Sep 11, 2024
Sold by
Ortiz Juan and Ortiz Angelita
Bought by
Gregg William Andrew and Gregg Emily
Current Estimated Value
Purchase Details
Closed on
Jul 13, 2015
Sold by
Wells Fargo Financial Texas Inc
Bought by
Cwd Groups 5 Llc
Home Financials for this Owner
Home Financials are based on the most recent Mortgage that was taken out on this home.
Original Mortgage
$52,000
Interest Rate
4.07%
Mortgage Type
Purchase Money Mortgage
Purchase Details
Closed on
Oct 7, 2014
Sold by
Wright Venable Anita K and Venabel David R
Bought by
Wells Fargo Financial Texas Inc
Purchase Details
Closed on
Nov 28, 2007
Sold by
Venable David R
Bought by
Williams Merri Lynn Bumbard
Create a Home Valuation Report for This Property
The Home Valuation Report is an in-depth analysis detailing your home's value as well as a comparison with similar homes in the area
Home Values in the Area
Average Home Value in this Area
Purchase History
| Date | Buyer | Sale Price | Title Company |
|---|---|---|---|
| Gregg William Andrew | -- | None Listed On Document | |
| Cwd Groups 5 Llc | -- | Servicelink Of Texas Llc | |
| Wells Fargo Financial Texas Inc | $68,721 | None Available | |
| Williams Merri Lynn Bumbard | -- | None Available |
Source: Public Records
Mortgage History
| Date | Status | Borrower | Loan Amount |
|---|---|---|---|
| Previous Owner | Cwd Groups 5 Llc | $52,000 | |
| Closed | Williams Merri Lynn Bumbard | $0 |
Source: Public Records
Tax History Compared to Growth
Tax History
| Year | Tax Paid | Tax Assessment Tax Assessment Total Assessment is a certain percentage of the fair market value that is determined by local assessors to be the total taxable value of land and additions on the property. | Land | Improvement |
|---|---|---|---|---|
| 2025 | $3,179 | $224,056 | $58,406 | $165,650 |
| 2024 | $3,179 | $186,856 | $24,129 | $214,717 |
| 2023 | $2,714 | $155,713 | $24,129 | $131,584 |
| 2022 | $3,047 | $155,502 | $18,614 | $136,888 |
| 2021 | $2,188 | $104,274 | $18,614 | $85,660 |
| 2020 | $2,134 | $99,732 | $18,614 | $81,118 |
| 2019 | $1,957 | $89,507 | $10,135 | $79,372 |
| 2018 | $1,944 | $89,389 | $10,135 | $79,254 |
| 2017 | $1,921 | $90,000 | $10,100 | $79,900 |
| 2016 | $1,921 | $90,000 | $10,100 | $79,900 |
| 2015 | $1,985 | $96,501 | $10,135 | $86,366 |
| 2014 | $1,985 | $93,397 | $10,135 | $83,262 |
Source: Public Records
Map
Nearby Homes
- 2527 S Robertson Ave
- 1203 Dogwood St
- 2715 S Robertson Ave
- 1407 Dogwood St
- 1411 Dogwood St
- 2622 Oak Ln
- 829 W 10th St
- 902 W 9th St
- 1314 S Azalea Dr
- 2809 S Robertson Ave
- 2864 S Robertson Ave
- 606 Tremont St
- 2521 S Vine Ave
- 2525 S Vine Ave
- 2529 S Vine Ave
- 1425 Dogwood St
- 2900 S Robertson Ave
- 1209 Terre Haute Dr
- 906 W 5th St
- 1720 Outer Dr
- 1019 Dogwood St
- 2409 Sunnybrook Dr
- 2409 2409 Sunnybrook
- 1027 Dogwood St
- 1020 Dogwood St
- 2435 Sunnybrook Dr
- 918 W Camellia St
- 918 918 W Camellia St
- 1028 Dogwood St
- 1101 Dogwood St
- 1012 S Azalea Dr
- 1100 W Camellia St
- 2422 Sunnybrook Dr
- 2441 2441 Sunnybrook
- 2441 Sunnybrook Dr
- 912 W Camellia St
- 1018 S Azalea Dr
- 1104 Dogwood St
- 1107 Dogwood St
- 2320 Sunnybrook Dr