Estimated Value: $322,769 - $349,000
3
Beds
2
Baths
2,137
Sq Ft
$156/Sq Ft
Est. Value
About This Home
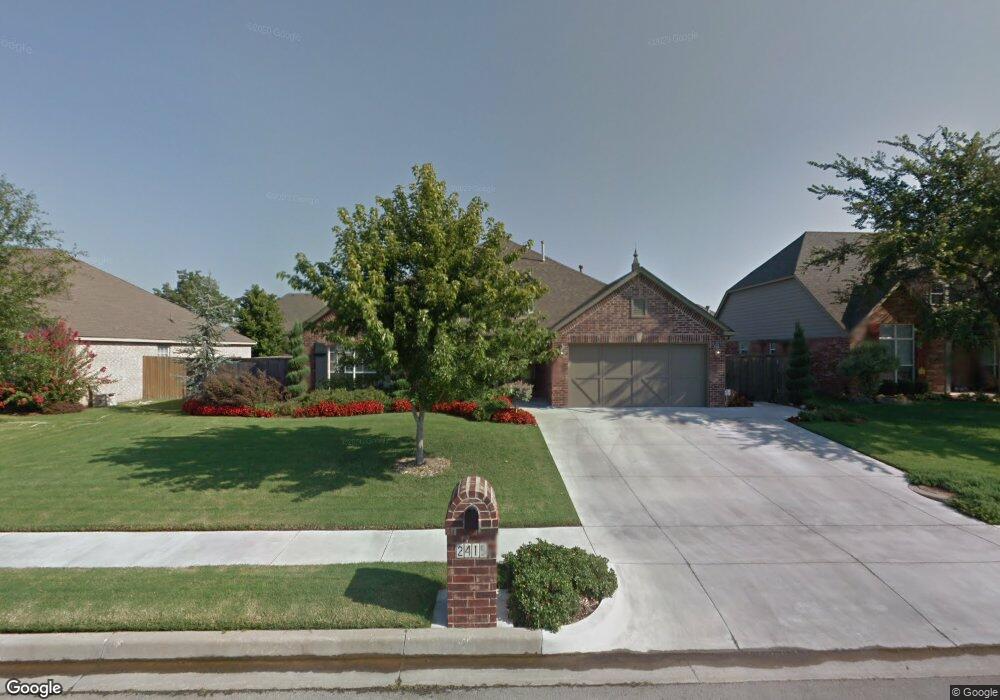
This home is located at 2415 W C St, Jenks, OK 74037 and is currently estimated at $332,942, approximately $155 per square foot. 2415 W C St is a home located in Tulsa County with nearby schools including Jenks West Elementary School, Jenks West Intermediate Elementary School, and Jenks Middle School.
Ownership History
Date
Name
Owned For
Owner Type
Purchase Details
Closed on
Sep 25, 2023
Sold by
Newell Kimberly
Bought by
Newell Nicholas
Current Estimated Value
Home Financials for this Owner
Home Financials are based on the most recent Mortgage that was taken out on this home.
Original Mortgage
$243,000
Outstanding Balance
$236,861
Interest Rate
6.25%
Mortgage Type
New Conventional
Estimated Equity
$96,081
Purchase Details
Closed on
Aug 25, 2021
Sold by
Goodwin Robert Casey and Goodwin Leslie
Bought by
Newell Nicholas and Newell Kimberly
Home Financials for this Owner
Home Financials are based on the most recent Mortgage that was taken out on this home.
Original Mortgage
$192,000
Interest Rate
2.8%
Mortgage Type
New Conventional
Purchase Details
Closed on
May 28, 2008
Sold by
Wathen Daniel R
Bought by
Goodwin Robert Casey and Goodwin Leslie
Purchase Details
Closed on
Aug 28, 2003
Sold by
Stanford Homes Llc
Bought by
Wathen Daniel R
Create a Home Valuation Report for This Property
The Home Valuation Report is an in-depth analysis detailing your home's value as well as a comparison with similar homes in the area
Home Values in the Area
Average Home Value in this Area
Purchase History
| Date | Buyer | Sale Price | Title Company |
|---|---|---|---|
| Newell Nicholas | -- | None Listed On Document | |
| Newell Nicholas | $240,000 | Multiple | |
| Goodwin Robert Casey | $188,000 | Multiple | |
| Wathen Daniel R | $173,000 | -- |
Source: Public Records
Mortgage History
| Date | Status | Borrower | Loan Amount |
|---|---|---|---|
| Open | Newell Nicholas | $243,000 | |
| Previous Owner | Newell Nicholas | $192,000 |
Source: Public Records
Tax History Compared to Growth
Tax History
| Year | Tax Paid | Tax Assessment Tax Assessment Total Assessment is a certain percentage of the fair market value that is determined by local assessors to be the total taxable value of land and additions on the property. | Land | Improvement |
|---|---|---|---|---|
| 2024 | $3,529 | $29,106 | $3,668 | $25,438 |
| 2023 | $3,529 | $27,720 | $3,716 | $24,004 |
| 2022 | $3,394 | $26,401 | $4,417 | $21,984 |
| 2021 | $2,812 | $21,598 | $3,661 | $17,937 |
| 2020 | $2,667 | $20,939 | $3,549 | $17,390 |
| 2019 | $2,603 | $20,300 | $3,441 | $16,859 |
| 2018 | $2,540 | $19,680 | $3,821 | $15,859 |
| 2017 | $2,499 | $20,680 | $4,015 | $16,665 |
| 2016 | $2,560 | $20,680 | $4,015 | $16,665 |
| 2015 | $2,609 | $20,680 | $4,015 | $16,665 |
| 2014 | $2,668 | $20,680 | $4,015 | $16,665 |
Source: Public Records
Map
Nearby Homes
- 2412 W D St
- 2428 W C St
- 508 N Willow St
- 9726 S Houston Ave
- 2102 W F Ct
- 2105 W F Ct
- 9402 S Elwood
- 9340 S Elwood Ave
- 507 N Emerson St
- 2040 E 129th Place S
- 1410 W 91st St
- 8732 S Quanah Ave
- 908 W 86th Place S
- 1107 W 86th Place S
- 922 W 86th St S
- 1114 W 86th St S
- 8723 S Phoenix Place W
- 1105 W 86th St S
- 912 W 85th St
- 914 W 85th St S