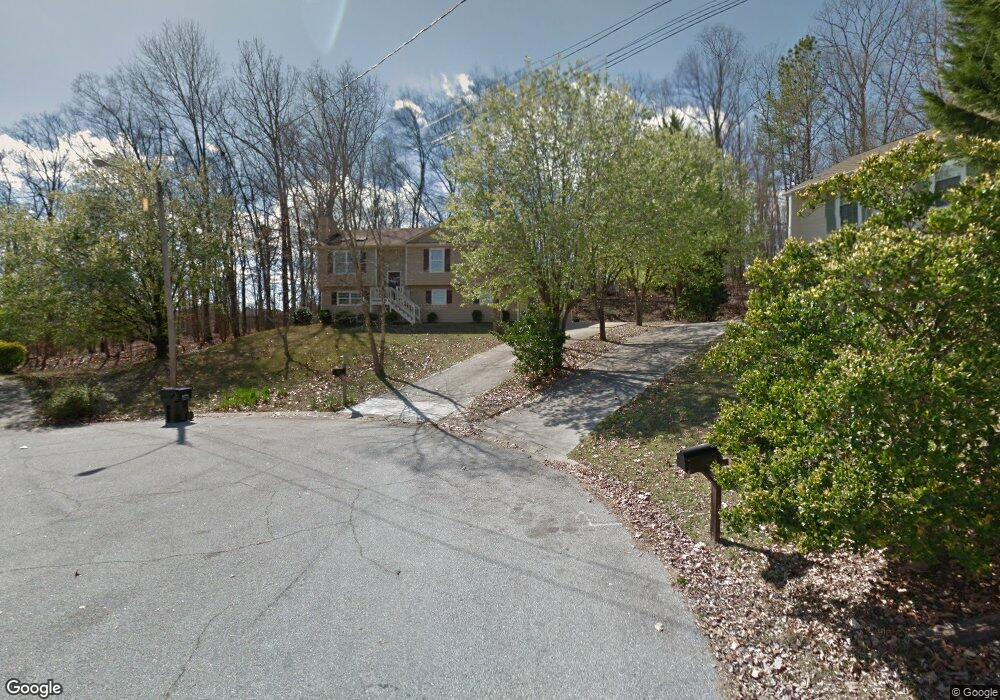
2415 Winding Creek Dr Unit 4 Lithia Springs, GA 30122
Lithia Springs NeighborhoodEstimated Value: $251,000 - $280,000
3
Beds
2
Baths
2,286
Sq Ft
$116/Sq Ft
Est. Value
About This Home
This home is located at 2415 Winding Creek Dr Unit 4, Lithia Springs, GA 30122 and is currently estimated at $266,118, approximately $116 per square foot. 2415 Winding Creek Dr Unit 4 is a home located in Douglas County with nearby schools including Sweetwater Elementary School, Factory Shoals Middle School, and Lithia Springs Comprehensive High School.
Ownership History
Date
Name
Owned For
Owner Type
Purchase Details
Closed on
Sep 11, 2015
Sold by
Tant Preston D
Bought by
Allen Debra
Current Estimated Value
Home Financials for this Owner
Home Financials are based on the most recent Mortgage that was taken out on this home.
Original Mortgage
$98,679
Outstanding Balance
$78,057
Interest Rate
4.12%
Mortgage Type
FHA
Estimated Equity
$188,061
Purchase Details
Closed on
Jul 30, 2010
Sold by
Ahb Homes Llc
Bought by
Tant Preston D
Home Financials for this Owner
Home Financials are based on the most recent Mortgage that was taken out on this home.
Original Mortgage
$82,106
Interest Rate
5.12%
Mortgage Type
FHA
Purchase Details
Closed on
Mar 15, 2010
Sold by
Citicorp Trust Bk Fsb
Bought by
Ahb Homes Llc
Purchase Details
Closed on
Oct 6, 2009
Sold by
Davis Pamela D
Bought by
Citicorp Trust Bk Fsb
Create a Home Valuation Report for This Property
The Home Valuation Report is an in-depth analysis detailing your home's value as well as a comparison with similar homes in the area
Home Values in the Area
Average Home Value in this Area
Purchase History
| Date | Buyer | Sale Price | Title Company |
|---|---|---|---|
| Allen Debra | $100,500 | -- | |
| Tant Preston D | $85,000 | -- | |
| Ahb Homes Llc | $25,000 | -- | |
| Citicorp Trust Bk Fsb | $45,470 | -- |
Source: Public Records
Mortgage History
| Date | Status | Borrower | Loan Amount |
|---|---|---|---|
| Open | Allen Debra | $98,679 | |
| Closed | Allen Debra | $5,000 | |
| Previous Owner | Tant Preston D | $82,106 |
Source: Public Records
Tax History Compared to Growth
Tax History
| Year | Tax Paid | Tax Assessment Tax Assessment Total Assessment is a certain percentage of the fair market value that is determined by local assessors to be the total taxable value of land and additions on the property. | Land | Improvement |
|---|---|---|---|---|
| 2024 | $1,188 | $99,080 | $26,600 | $72,480 |
| 2023 | $1,188 | $99,080 | $26,600 | $72,480 |
| 2022 | $2,701 | $80,960 | $21,280 | $59,680 |
| 2021 | $1,882 | $55,720 | $11,640 | $44,080 |
| 2020 | $1,904 | $55,720 | $11,640 | $44,080 |
| 2019 | $1,743 | $54,480 | $11,640 | $42,840 |
| 2018 | $1,492 | $46,160 | $10,120 | $36,040 |
| 2017 | $1,372 | $41,480 | $10,120 | $31,360 |
| 2016 | $1,184 | $34,960 | $8,800 | $26,160 |
| 2015 | $885 | $26,840 | $7,800 | $19,040 |
| 2014 | $885 | $28,040 | $8,680 | $19,360 |
| 2013 | -- | $29,800 | $9,240 | $20,560 |
Source: Public Records
Map
Nearby Homes
- 1535 Olde Oak Dr
- 8816 Sibella Ct
- 1774 Trail Creek Dr
- 2436 Falls River Dr
- 1815 Lee Rd
- 3686 Sweetbriar Cir
- 3652 Sweetbriar Cir
- 3570 Briar Dr
- 1940 Lee
- 2499 Chestnut Log Loop
- 3646 Briar Dr
- 2182 Ann Ln
- 3790 Sweetbriar Cir
- 2071 Oakcreek Dr
- 1928 Stonewood Dr
- 2623 Jordan Ln
- 2693 Jordan Ln
- 2683 Jordan Ln
- HAYDEN Plan at Fairhaven
- GREEN Plan at Fairhaven
- 2415 Winding Creek Dr
- 2428 Winding Creek Dr
- 2425 Winding Creek Dr Unit 4
- 2435 Winding Creek Dr Unit 4
- 2435 Winding Creek Dr
- 2696 Lantern Trail
- 2438 Winding Creek Dr
- 2706 Lantern Trail
- 2727 Cimmaron Trail
- 2717 Cimmaron Trail
- 2762 Woodbine Trail
- 2686 Lantern Trail
- 2707 Cimmaron Trail
- 2772 Woodbine Trail
- 2445 Winding Creek Dr
- 2448 Winding Creek Dr
- 2716 Lantern Trail
- 2697 Cimmaron Trail
- 2676 Lantern Trail
- 2752 Woodbine Trail