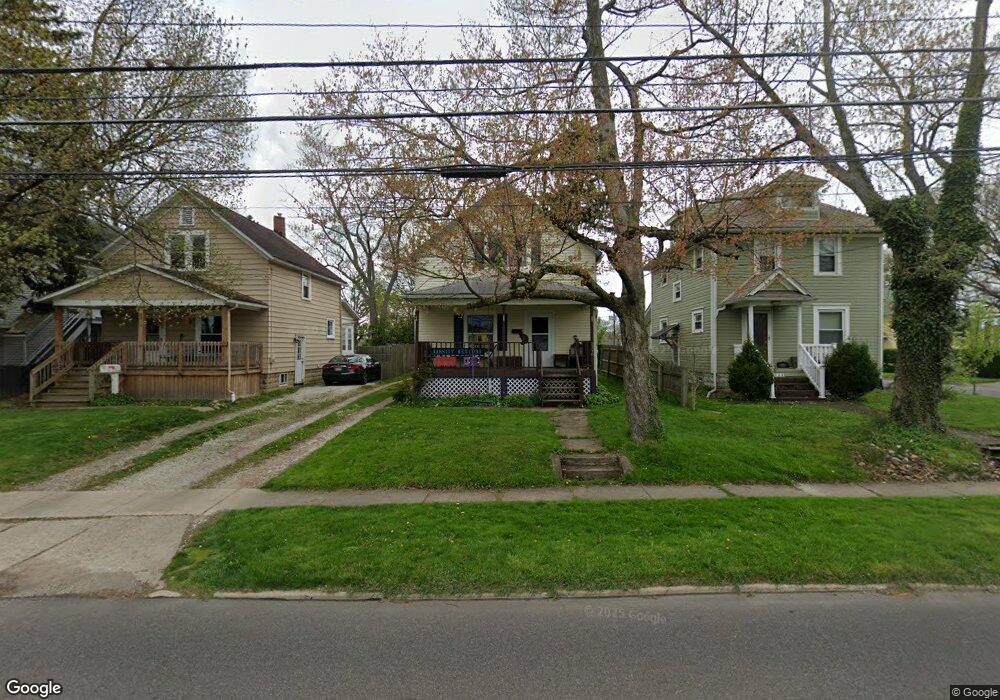
2416 6th St Cuyahoga Falls, OH 44221
Mud Brook NeighborhoodEstimated Value: $150,000 - $196,000
3
Beds
1
Bath
858
Sq Ft
$191/Sq Ft
Est. Value
About This Home
This home is located at 2416 6th St, Cuyahoga Falls, OH 44221 and is currently estimated at $163,801, approximately $190 per square foot. 2416 6th St is a home located in Summit County with nearby schools including Dewitt Elementary School, Bolich Middle School, and Cuyahoga Falls High School.
Ownership History
Date
Name
Owned For
Owner Type
Purchase Details
Closed on
Apr 25, 2006
Sold by
Staats Daniel P
Bought by
Horn Matthew C and Horn Alicia
Current Estimated Value
Home Financials for this Owner
Home Financials are based on the most recent Mortgage that was taken out on this home.
Original Mortgage
$18,000
Interest Rate
6.39%
Mortgage Type
Purchase Money Mortgage
Purchase Details
Closed on
Oct 8, 2003
Sold by
The Chase Manhattan Bank
Bought by
Staats Daniel P
Purchase Details
Closed on
May 14, 2003
Sold by
Leap Donald G
Bought by
The Chase Manhattan Bank and Imc Home Equity Loan Trust 1997-8
Create a Home Valuation Report for This Property
The Home Valuation Report is an in-depth analysis detailing your home's value as well as a comparison with similar homes in the area
Home Values in the Area
Average Home Value in this Area
Purchase History
| Date | Buyer | Sale Price | Title Company |
|---|---|---|---|
| Horn Matthew C | $90,000 | Acs Title & Closing | |
| Staats Daniel P | $63,000 | -- | |
| The Chase Manhattan Bank | $77,593 | -- |
Source: Public Records
Mortgage History
| Date | Status | Borrower | Loan Amount |
|---|---|---|---|
| Closed | Horn Matthew C | $18,000 |
Source: Public Records
Tax History Compared to Growth
Tax History
| Year | Tax Paid | Tax Assessment Tax Assessment Total Assessment is a certain percentage of the fair market value that is determined by local assessors to be the total taxable value of land and additions on the property. | Land | Improvement |
|---|---|---|---|---|
| 2025 | $2,243 | $41,549 | $9,202 | $32,347 |
| 2024 | $2,243 | $41,549 | $9,202 | $32,347 |
| 2023 | $2,243 | $41,549 | $9,202 | $32,347 |
| 2022 | $2,061 | $31,007 | $6,867 | $24,140 |
| 2021 | $2,061 | $31,007 | $6,867 | $24,140 |
| 2020 | $2,027 | $31,010 | $6,870 | $24,140 |
| 2019 | $1,947 | $27,130 | $6,870 | $20,260 |
| 2018 | $1,654 | $27,130 | $6,870 | $20,260 |
| 2017 | $1,456 | $27,130 | $6,870 | $20,260 |
| 2016 | $1,457 | $24,210 | $6,870 | $17,340 |
| 2015 | $1,456 | $24,210 | $6,870 | $17,340 |
| 2014 | $1,457 | $24,210 | $6,870 | $17,340 |
| 2013 | $1,722 | $28,860 | $6,870 | $21,990 |
Source: Public Records
Map
Nearby Homes