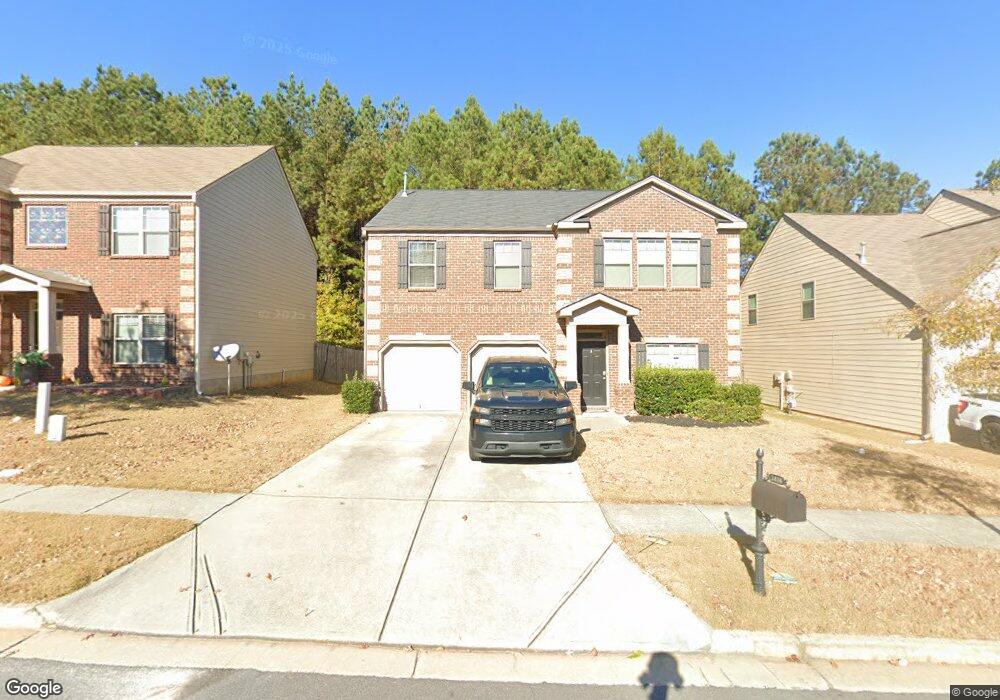
2416 Foxy Dr Unit LOT 122 Bethlehem, GA 30620
Estimated Value: $389,000 - $409,000
4
Beds
3
Baths
2,712
Sq Ft
$147/Sq Ft
Est. Value
About This Home
This home is located at 2416 Foxy Dr Unit LOT 122, Bethlehem, GA 30620 and is currently estimated at $399,648, approximately $147 per square foot. 2416 Foxy Dr Unit LOT 122 is a home located in Gwinnett County with nearby schools including Harbins Elementary School, McConnell Middle School, and Archer High School.
Ownership History
Date
Name
Owned For
Owner Type
Purchase Details
Closed on
Oct 22, 2025
Sold by
Jordan Joshua
Bought by
Jordan Joshua
Current Estimated Value
Home Financials for this Owner
Home Financials are based on the most recent Mortgage that was taken out on this home.
Original Mortgage
$299,000
Outstanding Balance
$298,719
Interest Rate
6.3%
Mortgage Type
Purchase Money Mortgage
Estimated Equity
$100,929
Purchase Details
Closed on
Jun 12, 2019
Sold by
Sph Property Two Llc
Bought by
Jordan Joshua and Bojarski Laura
Home Financials for this Owner
Home Financials are based on the most recent Mortgage that was taken out on this home.
Original Mortgage
$221,000
Interest Rate
4%
Mortgage Type
New Conventional
Purchase Details
Closed on
Jan 23, 2019
Sold by
Hinds Jennifer
Bought by
Sph Property Two Llc
Purchase Details
Closed on
Jan 13, 2017
Sold by
D R Horton-Crown Llc
Bought by
Hinds Anthony A and Hinds Jeniffer
Home Financials for this Owner
Home Financials are based on the most recent Mortgage that was taken out on this home.
Original Mortgage
$183,825
Interest Rate
4.16%
Mortgage Type
New Conventional
Purchase Details
Closed on
Nov 23, 2015
Sold by
Reo Funding Solutions Ii Llc
Bought by
D R Horton Crown Llc
Create a Home Valuation Report for This Property
The Home Valuation Report is an in-depth analysis detailing your home's value as well as a comparison with similar homes in the area
Home Values in the Area
Average Home Value in this Area
Purchase History
| Date | Buyer | Sale Price | Title Company |
|---|---|---|---|
| Jordan Joshua | -- | -- | |
| Jordan Joshua | $235,000 | -- | |
| Sph Property Two Llc | $243,800 | -- | |
| Hinds Anthony A | $204,250 | -- | |
| D R Horton Crown Llc | -- | -- |
Source: Public Records
Mortgage History
| Date | Status | Borrower | Loan Amount |
|---|---|---|---|
| Open | Jordan Joshua | $299,000 | |
| Previous Owner | Jordan Joshua | $221,000 | |
| Previous Owner | Hinds Anthony A | $183,825 |
Source: Public Records
Tax History Compared to Growth
Tax History
| Year | Tax Paid | Tax Assessment Tax Assessment Total Assessment is a certain percentage of the fair market value that is determined by local assessors to be the total taxable value of land and additions on the property. | Land | Improvement |
|---|---|---|---|---|
| 2025 | $5,708 | $174,960 | $30,000 | $144,960 |
| 2024 | $5,415 | $153,880 | $30,000 | $123,880 |
| 2023 | $5,415 | $158,160 | $34,000 | $124,160 |
| 2022 | $5,352 | $141,800 | $30,000 | $111,800 |
| 2021 | $4,112 | $105,320 | $22,400 | $82,920 |
| 2020 | $3,725 | $94,000 | $19,600 | $74,400 |
| 2019 | $3,658 | $96,000 | $19,600 | $76,400 |
| 2018 | $3,159 | $81,680 | $17,200 | $64,480 |
| 2016 | $664 | $11,520 | $11,520 | $0 |
| 2015 | $439 | $11,520 | $11,520 | $0 |
| 2014 | $100 | $1,960 | $1,960 | $0 |
Source: Public Records
Map
Nearby Homes
- 2060 Marlborough Dr
- 3601 Indian Shoals Rd SE
- 3001 Saratoga Sky Way
- 3550 Topeka Springs Trail
- 3893 Indian Shoals Rd SE
- 3617 Shoal Trail Dr SE
- 3442 Flat Run Dr SE
- 3442 Flat Run Dr Unit 1
- 3424 Pratt Way
- 3344 Pratt Way
- 3287 Hall Rd
- 3512 Flat Run Dr Unit 2
- 3825 Hall Rd
- 3042 Lowell Rd
- 3383 Arabian Farm Ln
- 2410 Ames St
- 2416 Foxy Dr
- 2426 Foxy Dr Unit LOT 123
- 2426 Foxy Dr
- 0 Foxy Dr Unit 3724931
- 0 Foxy Dr Unit 7005372
- 0 Foxy Dr Unit 8725106
- 0 Foxy Dr Unit 8862006
- 0 Foxy Dr Unit 8974395
- 0 Foxy Dr Unit 9045395
- 0 Foxy Dr Unit 9067007
- 0 Foxy Dr Unit 9055044
- 0 Foxy Dr Unit 8773056
- 0 Foxy Dr Unit 8803481
- 0 Foxy Dr Unit 8848243
- 0 Foxy Dr Unit 8884163
- 251 Foxy Dr
- 0 Foxy Dr Unit 2835785
- 0 Foxy Dr Unit 8027803
- 0 Foxy Dr Unit 8032770
- 0 Foxy Dr Unit 8036131