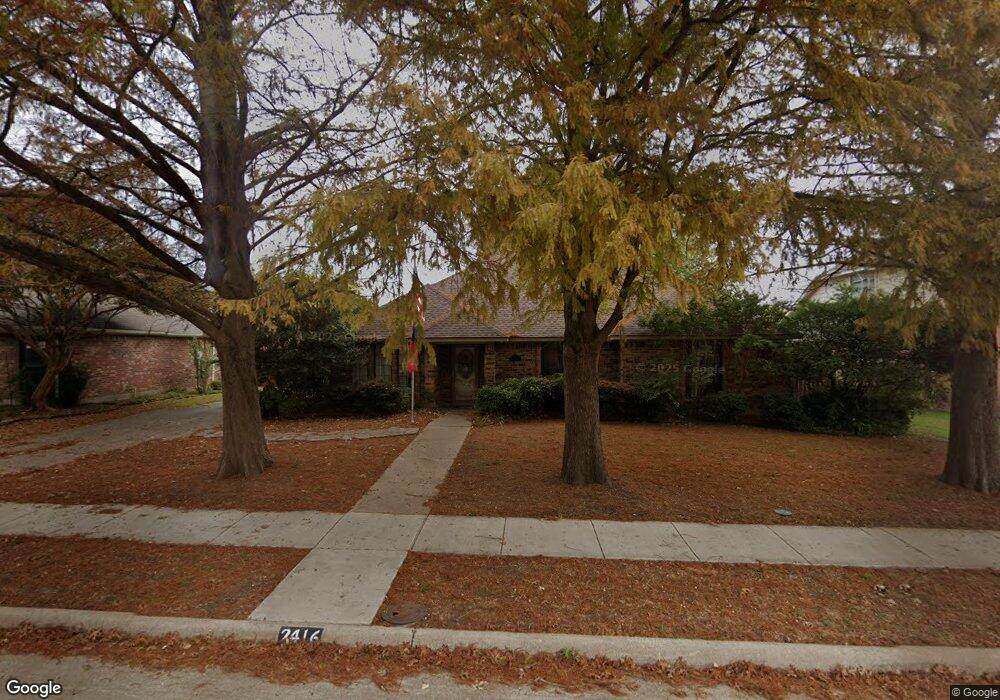
2416 Riverview Dr McKinney, TX 75071
North McKinney NeighborhoodEstimated Value: $363,167 - $382,000
3
Beds
2
Baths
2,009
Sq Ft
$186/Sq Ft
Est. Value
About This Home
This home is located at 2416 Riverview Dr, McKinney, TX 75071 and is currently estimated at $373,042, approximately $185 per square foot. 2416 Riverview Dr is a home located in Collin County with nearby schools including Vega Elementary School, Scott Morgan Johnson Middle School, and Mckinney North High School.
Ownership History
Date
Name
Owned For
Owner Type
Purchase Details
Closed on
Apr 7, 2017
Sold by
Ff Lewin Family Limited Partnerhp
Bought by
Lawless Mark and Lawless Marla
Current Estimated Value
Home Financials for this Owner
Home Financials are based on the most recent Mortgage that was taken out on this home.
Original Mortgage
$200,000
Outstanding Balance
$166,202
Interest Rate
4.16%
Mortgage Type
New Conventional
Estimated Equity
$206,840
Purchase Details
Closed on
Jan 20, 2012
Sold by
Lindstrom Troy R and Lindstrom Mary E
Bought by
Ef Lewis Family Limited Partnership
Purchase Details
Closed on
Aug 12, 1998
Sold by
Knight Thomas Aaron and Knight Sherry J
Bought by
Lindstrom Troy R and Lindstrom Mary E
Home Financials for this Owner
Home Financials are based on the most recent Mortgage that was taken out on this home.
Original Mortgage
$80,000
Interest Rate
6.9%
Create a Home Valuation Report for This Property
The Home Valuation Report is an in-depth analysis detailing your home's value as well as a comparison with similar homes in the area
Home Values in the Area
Average Home Value in this Area
Purchase History
| Date | Buyer | Sale Price | Title Company |
|---|---|---|---|
| Lawless Mark | -- | Fidelity National Title | |
| Ef Lewis Family Limited Partnership | -- | Rtt | |
| Lindstrom Troy R | -- | -- |
Source: Public Records
Mortgage History
| Date | Status | Borrower | Loan Amount |
|---|---|---|---|
| Open | Lawless Mark | $200,000 | |
| Previous Owner | Lindstrom Troy R | $80,000 |
Source: Public Records
Tax History Compared to Growth
Tax History
| Year | Tax Paid | Tax Assessment Tax Assessment Total Assessment is a certain percentage of the fair market value that is determined by local assessors to be the total taxable value of land and additions on the property. | Land | Improvement |
|---|---|---|---|---|
| 2025 | $2,778 | $335,003 | $100,000 | $235,003 |
| 2024 | $2,778 | $320,781 | $100,000 | $277,142 |
| 2023 | $2,778 | $291,619 | $95,000 | $290,686 |
| 2022 | $5,313 | $265,108 | $85,000 | $261,881 |
| 2021 | $5,118 | $241,007 | $60,000 | $181,007 |
| 2020 | $5,237 | $231,709 | $60,000 | $171,709 |
| 2019 | $5,559 | $233,855 | $60,000 | $173,855 |
| 2018 | $5,486 | $225,572 | $55,000 | $170,572 |
| 2017 | $4,745 | $195,092 | $50,000 | $145,092 |
| 2016 | $4,214 | $169,736 | $45,000 | $124,736 |
| 2015 | $3,326 | $153,064 | $35,000 | $118,064 |
Source: Public Records
Map
Nearby Homes
- 2412 Crestview Dr
- 2106 Redondo Dr
- 2123 Quail Run
- 2110 Quail Run
- 2201 Spruce Cir
- 2119 Quail Run
- 2720 Prairie Creek Dr
- 2701 Cattleman Dr
- 2600 Terrace Dr
- 2614 Hidden Valley Dr
- 2845 Chisos Red Rd
- 2849 Chisos Red Rd
- 2840 Chisos Red Rd
- 2853 Chisos Red Rd
- 2404 Marshbrook Dr
- 2816 Jacaranda Dr
- 2616 Mountain View Dr
- Hansen Plan at Village District at Painted Tree - Village District
- Boyd Plan at Village District at Painted Tree - Village District
- Tatum Plan at Village District at Painted Tree - Village District
- 2414 Riverview Dr
- 2418 Riverview Dr
- 2415 Ridgevalley Dr
- 2415 Ridgevalley Dr
- 2413 Ridgevalley Dr
- 2417 Ridgevalley Dr
- 2412 Riverview Dr
- 2420 Riverview Dr
- 2415 Riverview Dr
- 2413 Riverview Dr
- 2417 Riverview Dr
- 2411 Ridgevalley Dr
- 2419 Ridgevalley Dr
- 2410 Riverview Dr
- 2411 Riverview Dr
- 2419 Riverview Dr
- 2422 Riverview Dr
- 2409 Ridgevalley Dr
- 2421 Ridgevalley Dr
- 2202 Ridgewood Dr