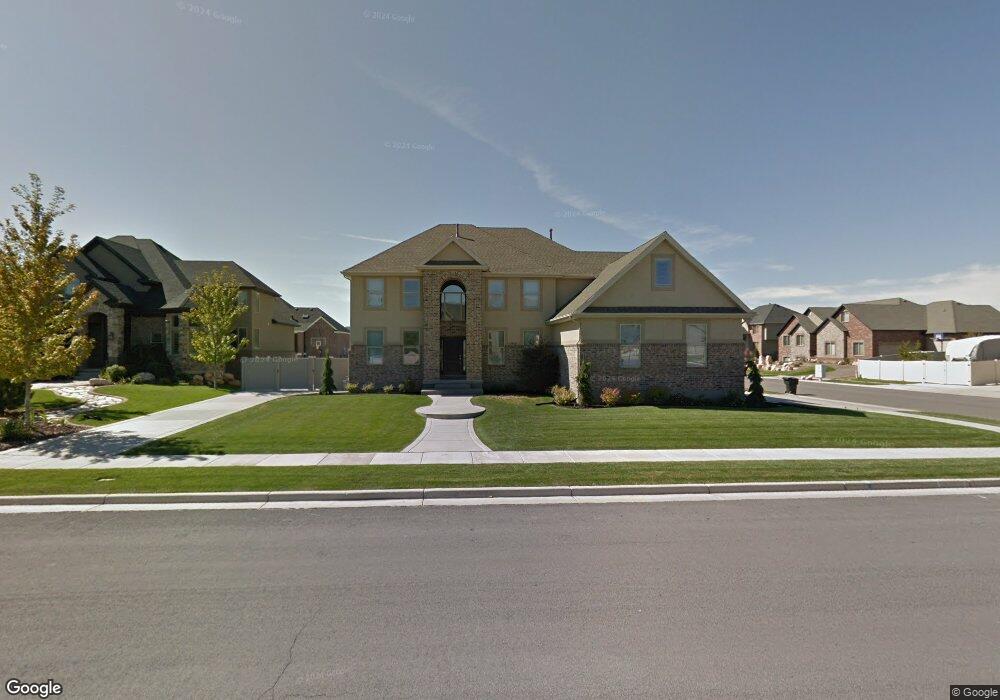
2416 S 600 W Syracuse, UT 84075
Estimated Value: $916,000 - $1,084,000
5
Beds
4
Baths
3,774
Sq Ft
$262/Sq Ft
Est. Value
About This Home
This home is located at 2416 S 600 W, Syracuse, UT 84075 and is currently estimated at $989,761, approximately $262 per square foot. 2416 S 600 W is a home located in Davis County with nearby schools including Bluff Ridge Elementary, Legacy Junior High School, and Clearfield High School.
Ownership History
Date
Name
Owned For
Owner Type
Purchase Details
Closed on
Apr 11, 2007
Sold by
Johnson Glorya J
Bought by
Hale Brian and Hale Angela
Current Estimated Value
Home Financials for this Owner
Home Financials are based on the most recent Mortgage that was taken out on this home.
Original Mortgage
$356,900
Outstanding Balance
$214,485
Interest Rate
6.13%
Mortgage Type
Purchase Money Mortgage
Estimated Equity
$775,276
Purchase Details
Closed on
Dec 7, 2005
Sold by
Johnson Glorya Jean
Bought by
Johnson Glorya J
Home Financials for this Owner
Home Financials are based on the most recent Mortgage that was taken out on this home.
Original Mortgage
$90,250
Interest Rate
6.14%
Mortgage Type
Stand Alone Second
Purchase Details
Closed on
Oct 14, 2004
Sold by
Scott Baker Construction Inc
Bought by
Damn Loco Inc
Create a Home Valuation Report for This Property
The Home Valuation Report is an in-depth analysis detailing your home's value as well as a comparison with similar homes in the area
Home Values in the Area
Average Home Value in this Area
Purchase History
| Date | Buyer | Sale Price | Title Company |
|---|---|---|---|
| Hale Brian | -- | Utah Commercial Title Co | |
| Johnson Glorya J | -- | Meridian Title Company | |
| Damn Loco Inc | -- | Bonneville Title Company Inc |
Source: Public Records
Mortgage History
| Date | Status | Borrower | Loan Amount |
|---|---|---|---|
| Open | Hale Brian | $356,900 | |
| Previous Owner | Johnson Glorya J | $90,250 | |
| Previous Owner | Johnson Glorya J | $399,000 |
Source: Public Records
Tax History
| Year | Tax Paid | Tax Assessment Tax Assessment Total Assessment is a certain percentage of the fair market value that is determined by local assessors to be the total taxable value of land and additions on the property. | Land | Improvement |
|---|---|---|---|---|
| 2025 | $5,638 | $543,950 | $123,035 | $420,915 |
| 2024 | $5,436 | $528,001 | $106,024 | $421,977 |
| 2023 | $4,820 | $853,000 | $147,481 | $705,519 |
| 2022 | $4,654 | $451,550 | $84,301 | $367,249 |
| 2021 | $3,995 | $600,000 | $125,070 | $474,930 |
| 2020 | $3,707 | $539,000 | $106,796 | $432,204 |
| 2019 | $3,608 | $518,000 | $107,028 | $410,972 |
| 2018 | $3,270 | $466,000 | $101,940 | $364,060 |
| 2016 | $3,272 | $244,530 | $39,030 | $205,500 |
| 2015 | $3,543 | $252,120 | $39,030 | $213,090 |
| 2014 | $4,051 | $293,810 | $39,030 | $254,780 |
| 2013 | -- | $213,678 | $37,712 | $175,966 |
Source: Public Records
Map
Nearby Homes
Your Personal Tour Guide
Ask me questions while you tour the home.