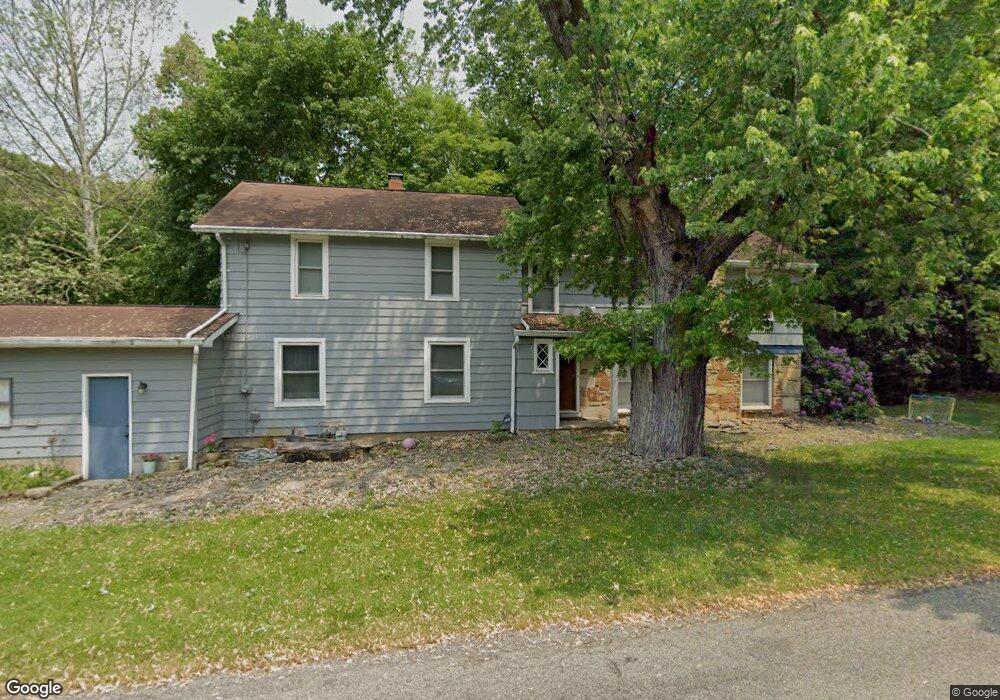
2417 Cadwallader Sonk Rd Cortland, OH 44410
Estimated Value: $217,000 - $275,000
3
Beds
3
Baths
2,260
Sq Ft
$111/Sq Ft
Est. Value
About This Home
This home is located at 2417 Cadwallader Sonk Rd, Cortland, OH 44410 and is currently estimated at $251,045, approximately $111 per square foot. 2417 Cadwallader Sonk Rd is a home located in Trumbull County with nearby schools including Lakeview Elementary School, Lakeview Middle School, and Lakeview High School.
Ownership History
Date
Name
Owned For
Owner Type
Purchase Details
Closed on
Dec 21, 2015
Sold by
Ciuba Gary M
Bought by
Hoerig Stephen Hoerig Kim
Current Estimated Value
Home Financials for this Owner
Home Financials are based on the most recent Mortgage that was taken out on this home.
Interest Rate
3.97%
Purchase Details
Closed on
May 30, 2012
Sold by
Ciuba Gary M and Rogan Patricia
Bought by
Hoerig Stephen and Hoerig Kimberly
Home Financials for this Owner
Home Financials are based on the most recent Mortgage that was taken out on this home.
Original Mortgage
$110,000
Interest Rate
3.92%
Mortgage Type
Seller Take Back
Purchase Details
Closed on
Feb 23, 1994
Sold by
Jacobson Merrilee B
Bought by
Gary M Ciuba
Purchase Details
Closed on
Jan 1, 1990
Bought by
Merrilee B Jacobson
Create a Home Valuation Report for This Property
The Home Valuation Report is an in-depth analysis detailing your home's value as well as a comparison with similar homes in the area
Home Values in the Area
Average Home Value in this Area
Purchase History
| Date | Buyer | Sale Price | Title Company |
|---|---|---|---|
| Hoerig Stephen Hoerig Kim | $120,000 | -- | |
| Hoerig Stephen | $120,000 | None Available | |
| Gary M Ciuba | $93,500 | -- | |
| Merrilee B Jacobson | -- | -- |
Source: Public Records
Mortgage History
| Date | Status | Borrower | Loan Amount |
|---|---|---|---|
| Closed | Hoerig Stephen Hoerig Kim | -- | |
| Previous Owner | Hoerig Stephen | $110,000 |
Source: Public Records
Tax History Compared to Growth
Tax History
| Year | Tax Paid | Tax Assessment Tax Assessment Total Assessment is a certain percentage of the fair market value that is determined by local assessors to be the total taxable value of land and additions on the property. | Land | Improvement |
|---|---|---|---|---|
| 2024 | $2,622 | $51,980 | $6,410 | $45,570 |
| 2023 | $2,622 | $51,980 | $6,410 | $45,570 |
| 2022 | $2,464 | $42,780 | $5,990 | $36,790 |
| 2021 | $2,473 | $42,780 | $5,990 | $36,790 |
| 2020 | $2,487 | $42,780 | $5,990 | $36,790 |
| 2019 | $2,269 | $37,520 | $5,530 | $31,990 |
| 2018 | $2,280 | $37,520 | $5,530 | $31,990 |
| 2017 | $2,275 | $37,520 | $5,530 | $31,990 |
| 2016 | $2,101 | $33,530 | $5,530 | $28,000 |
| 2015 | $2,107 | $33,530 | $5,530 | $28,000 |
| 2014 | $1,940 | $33,530 | $5,530 | $28,000 |
| 2013 | $1,976 | $33,530 | $5,530 | $28,000 |
Source: Public Records
Map
Nearby Homes
- 0 Niles Ashtabula Rd Unit 5147189
- 2342 McCleary Jacoby Rd
- 2261 Saddlebrook Ln
- 2047 Quail Run Dr
- 0 Muir Woods Dr
- 4 Niles Cortland Rd NE
- 1 Oh-46
- 0 #3 Niles Cortland Rd- Sr 46 Unit 4274646
- 0 Niles Cortland Rd Sr 46 Unit 4273262
- 5 Oh-46
- 3339 Eagles Loft
- 0 Black Duck Ct Unit 5133669
- 3477 Ivy Hill Cir Unit B
- 2133 Silver Fox Ln NE
- 106 N Aspen Ct Unit 4
- 3012 Ivy Hill Cir
- 3233 Niles Cortland Rd NE
- 3093 Ivy Hill Cir Unit D
- 3063 Ivy Hill Cir Unit D
- 255 S Linden Ct Unit 3
- 2432 Cadwallader Sonk Rd
- 2405 Cadwallader Sonk Rd
- 2424 Cadwallader Sonk Rd
- 2455 Cadwallader Sonk Rd
- 2408 Cadwallader Sonk Rd
- 2408 Cadwallader Sonk Rd
- 2416 Cadwallader Sonk Rd
- 2450 Cadwallader Sonk Rd
- 2469 Cadwallader Sonk Rd
- 2332 Cadwallader Sonk Rd
- 2474 Cadwallader Sonk Rd
- 2489 Cadwallader Sonk Rd
- 2364 Cadwallader Sonk Rd
- 2466 Cadwallader Sonk Rd
- 2490 Cadwallader Sonk Rd
- 2342 Cadwallader Sonk Rd
- 2544 Niles Cortland Rd NE
- 2510 Cadwallader Sonk Rd
- 2515 Cadwallader Sonk Rd
- 2472 Niles Cortland Rd NE