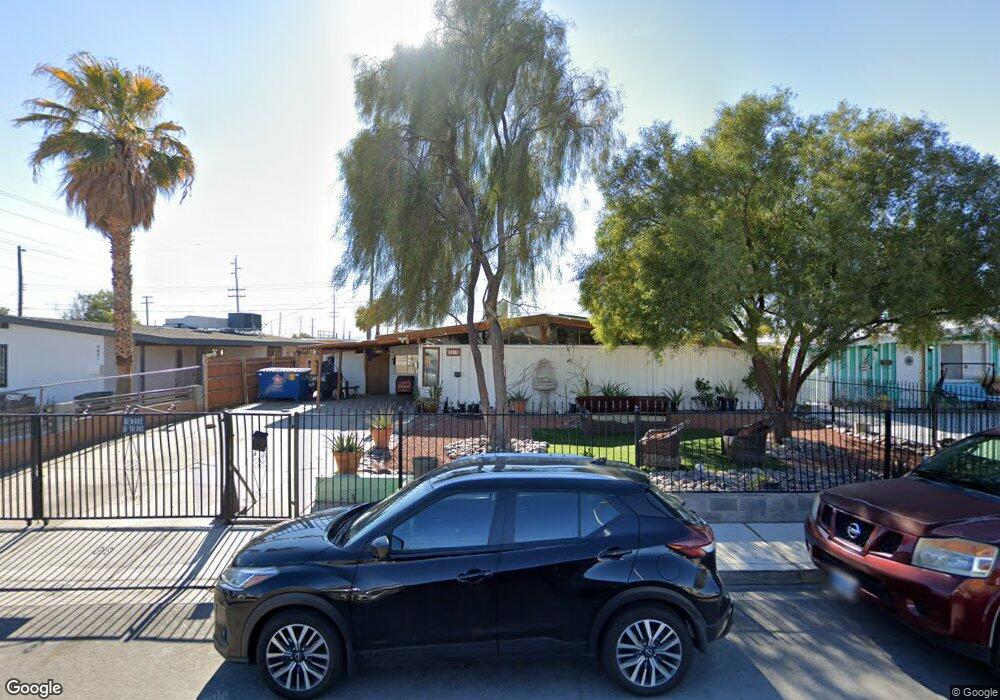
2417 E Mcwilliams Ave Las Vegas, NV 89101
Downtown Las Vegas NeighborhoodEstimated Value: $286,000 - $382,000
4
Beds
2
Baths
1,634
Sq Ft
$210/Sq Ft
Est. Value
About This Home
This home is located at 2417 E Mcwilliams Ave, Las Vegas, NV 89101 and is currently estimated at $342,353, approximately $209 per square foot. 2417 E Mcwilliams Ave is a home located in Clark County with nearby schools including Halle Hewetson Elementary School, J.D. Smith Middle School, and Rancho High School.
Ownership History
Date
Name
Owned For
Owner Type
Purchase Details
Closed on
Mar 12, 2004
Sold by
Casas Belem Avandano
Bought by
Quintanilla Tulio
Current Estimated Value
Home Financials for this Owner
Home Financials are based on the most recent Mortgage that was taken out on this home.
Original Mortgage
$109,600
Outstanding Balance
$51,294
Interest Rate
5.69%
Mortgage Type
Unknown
Estimated Equity
$291,059
Purchase Details
Closed on
Mar 11, 2004
Sold by
Dupuis Investment Services Ltd
Bought by
Quintanilla Tulio
Home Financials for this Owner
Home Financials are based on the most recent Mortgage that was taken out on this home.
Original Mortgage
$109,600
Outstanding Balance
$51,294
Interest Rate
5.69%
Mortgage Type
Unknown
Estimated Equity
$291,059
Purchase Details
Closed on
Jul 31, 2003
Sold by
Gray Gary A
Bought by
Dupuis Investment Services Ltd
Purchase Details
Closed on
Aug 3, 1996
Sold by
Nelson Raymond L
Bought by
Nelson Raymond L
Create a Home Valuation Report for This Property
The Home Valuation Report is an in-depth analysis detailing your home's value as well as a comparison with similar homes in the area
Home Values in the Area
Average Home Value in this Area
Purchase History
| Date | Buyer | Sale Price | Title Company |
|---|---|---|---|
| Quintanilla Tulio | $137,000 | Fidelity National Title | |
| Quintanilla Tulio | $137,000 | Fidelity National Title | |
| Dupuis Investment Services Ltd | $93,000 | Fidelity National Title | |
| Nelson Raymond L | -- | -- |
Source: Public Records
Mortgage History
| Date | Status | Borrower | Loan Amount |
|---|---|---|---|
| Open | Quintanilla Tulio | $109,600 | |
| Closed | Quintanilla Tulio | $27,400 |
Source: Public Records
Tax History Compared to Growth
Tax History
| Year | Tax Paid | Tax Assessment Tax Assessment Total Assessment is a certain percentage of the fair market value that is determined by local assessors to be the total taxable value of land and additions on the property. | Land | Improvement |
|---|---|---|---|---|
| 2025 | $606 | $45,798 | $25,900 | $19,898 |
| 2024 | $589 | $45,798 | $25,900 | $19,898 |
| 2023 | $480 | $47,005 | $29,050 | $17,955 |
| 2022 | $572 | $39,485 | $23,450 | $16,035 |
| 2021 | $555 | $32,436 | $17,500 | $14,936 |
| 2020 | $536 | $30,275 | $15,750 | $14,525 |
| 2019 | $521 | $27,988 | $14,000 | $13,988 |
| 2018 | $505 | $26,033 | $12,950 | $13,083 |
| 2017 | $769 | $23,464 | $10,500 | $12,964 |
| 2016 | $480 | $20,617 | $8,050 | $12,567 |
| 2015 | $478 | $17,787 | $5,600 | $12,187 |
| 2014 | $464 | $14,680 | $4,200 | $10,480 |
Source: Public Records
Map
Nearby Homes
- 921 Delta St
- 709 N 22nd St
- 920 E Bonanza Rd
- 828 N 21st St
- 2600 E Bonanza Rd
- 2020 E Bonanza Rd
- 437 N 23rd St
- 0 Mcknight St
- 744 Mcknight St
- 1812 Ryan Ave
- 2016 Linden Ave
- 2624 Brady Ave Unit 1
- 2813 Willoughby Ave
- 1908 Linden Ave
- 2218 E Mesquite Ave
- 1705 Leslie Ave Unit 1
- 2516 E Mesquite Ave
- 624 N Bruce St
- 2005 Jansen Ave
- 2513 Cedar Ave
- 2421 E Mcwilliams Ave
- 2413 E Mcwilliams Ave
- 720 Delta St
- 2409 E Mcwilliams Ave
- 724 Delta St
- 2416 E Mcwilliams Ave
- 721 N Eastern Ave
- 2420 E Mcwilliams Ave
- 716 Delta St
- 2412 E Mcwilliams Ave
- 2405 E Mcwilliams Ave
- 2424 E Mcwilliams Ave
- 2408 E Mcwilliams Ave
- 721 Delta St
- 717 N Eastern Ave
- 712 Delta St
- 2401 E Mcwilliams Ave
- 2404 E Mcwilliams Ave
- 717 Delta St
- 2400 E Mcwilliams Ave