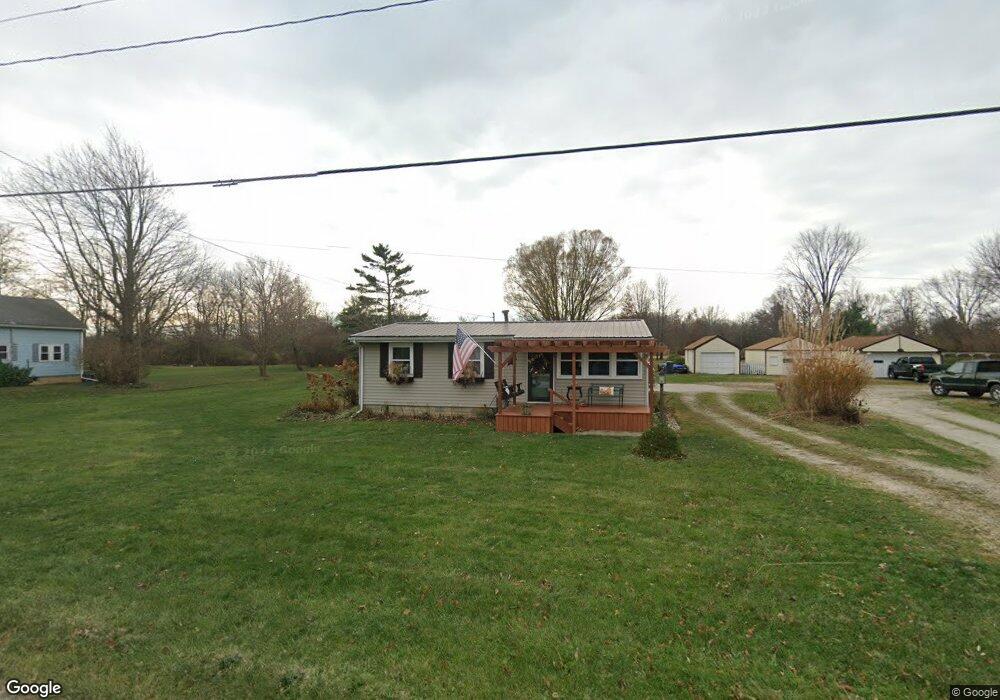
2417 E State St Fremont, OH 43420
Estimated Value: $130,367 - $219,000
3
Beds
1
Bath
864
Sq Ft
$189/Sq Ft
Est. Value
About This Home
This home is located at 2417 E State St, Fremont, OH 43420 and is currently estimated at $163,592, approximately $189 per square foot. 2417 E State St is a home located in Sandusky County with nearby schools including Fremont Ross High School, Temple Christian Academy, and Sacred Heart School.
Ownership History
Date
Name
Owned For
Owner Type
Purchase Details
Closed on
Jan 31, 2012
Sold by
Fasnacht Kimberly K
Bought by
Fasnacht Kimberly K and Kimberly K Fasnacht Revocable Living Tru
Current Estimated Value
Purchase Details
Closed on
Oct 20, 2003
Sold by
Randall Patrick A and Randall Lisa J
Bought by
Fasnacht Kimberly K
Home Financials for this Owner
Home Financials are based on the most recent Mortgage that was taken out on this home.
Original Mortgage
$72,000
Outstanding Balance
$33,692
Interest Rate
6.25%
Mortgage Type
Purchase Money Mortgage
Estimated Equity
$129,900
Purchase Details
Closed on
Oct 28, 1994
Sold by
Klos Thomas M
Bought by
Randall Patrick A
Home Financials for this Owner
Home Financials are based on the most recent Mortgage that was taken out on this home.
Original Mortgage
$44,550
Interest Rate
8.68%
Mortgage Type
New Conventional
Purchase Details
Closed on
Nov 1, 1984
Bought by
Fasnacht Kimberly K Trustee
Create a Home Valuation Report for This Property
The Home Valuation Report is an in-depth analysis detailing your home's value as well as a comparison with similar homes in the area
Home Values in the Area
Average Home Value in this Area
Purchase History
| Date | Buyer | Sale Price | Title Company |
|---|---|---|---|
| Fasnacht Kimberly K | -- | None Available | |
| Fasnacht Kimberly K | $61,500 | Midland Title | |
| Randall Patrick A | $49,500 | -- | |
| Fasnacht Kimberly K Trustee | $34,000 | -- |
Source: Public Records
Mortgage History
| Date | Status | Borrower | Loan Amount |
|---|---|---|---|
| Open | Fasnacht Kimberly K | $72,000 | |
| Previous Owner | Randall Patrick A | $44,550 |
Source: Public Records
Tax History Compared to Growth
Tax History
| Year | Tax Paid | Tax Assessment Tax Assessment Total Assessment is a certain percentage of the fair market value that is determined by local assessors to be the total taxable value of land and additions on the property. | Land | Improvement |
|---|---|---|---|---|
| 2024 | $1,423 | $36,550 | $18,800 | $17,750 |
| 2023 | $1,423 | $26,290 | $13,510 | $12,780 |
| 2022 | $1,094 | $26,290 | $13,510 | $12,780 |
| 2021 | $1,127 | $26,290 | $13,510 | $12,780 |
| 2020 | $1,128 | $25,800 | $13,510 | $12,290 |
| 2019 | $1,127 | $25,800 | $13,510 | $12,290 |
| 2018 | $1,051 | $25,800 | $13,510 | $12,290 |
| 2017 | $1,077 | $25,200 | $13,510 | $11,690 |
| 2016 | $944 | $25,200 | $13,510 | $11,690 |
| 2015 | $928 | $25,200 | $13,510 | $11,690 |
| 2014 | $1,027 | $26,710 | $12,360 | $14,350 |
| 2013 | $1,031 | $26,710 | $12,360 | $14,350 |
Source: Public Records
Map
Nearby Homes
- 2248 E State St
- 1014 S County Road 198
- 199 Saint Thomas Dr
- 251 Saint Paul Dr
- 263 Saint Paul Dr
- 315 Ethan Dr
- 318 Ethan Dr
- 1526 Sunrise Blvd
- 800 Lawndale Dr
- 546 Oaklawn Ave
- 335 Cottage St
- 230 N Pennsylvania Ave
- 309 S Collinwood Blvd
- 314 S Collinwood Blvd
- 906 Amsden Blvd
- 0 S Buchanan St
- 600 S Buchanan St
- 714 E State St
- 0 Cr 214 Unit 20253055
- 322 4th St
- 2415 E State St
- 2449 E State St
- 2472 E State St
- 2507 E State St Unit 1
- 2507 E State St
- 601 Timpe Rd
- 515 Timpe Rd
- 613 Timpe Rd
- 516 Timpe Rd
- 709 Timpe Rd
- 612 Timpe Rd
- 2554 E State St
- 600 Timpe Rd
- 2276 E State St
- 2268 E State St
- 708 Timpe Rd
- 708 Timpe Rd
- 526 Timpe Rd
- 450 S County Road 198
- 2266 E State St