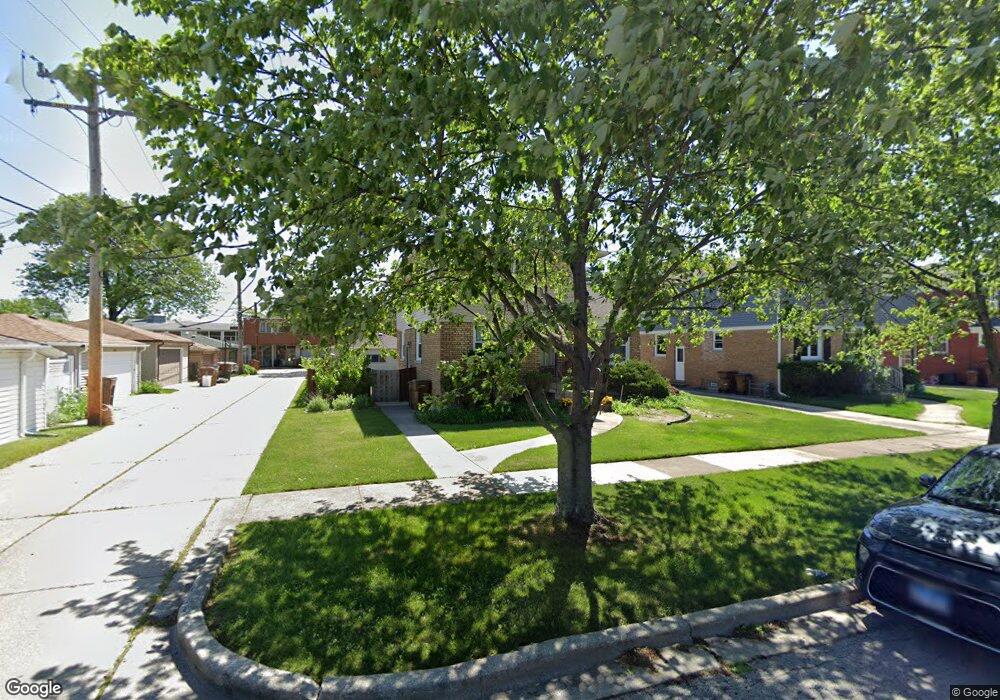
2417 S 11th Ave Broadview, IL 60155
Estimated Value: $248,997 - $266,000
2
Beds
1
Bath
807
Sq Ft
$318/Sq Ft
Est. Value
About This Home
This home is located at 2417 S 11th Ave, Broadview, IL 60155 and is currently estimated at $256,499, approximately $317 per square foot. 2417 S 11th Ave is a home located in Cook County with nearby schools including Lindop Elementary School, Proviso East High School, and Maywood Margery Daw Day Care.
Ownership History
Date
Name
Owned For
Owner Type
Purchase Details
Closed on
May 21, 2004
Sold by
Smith Riley Cassandra D
Bought by
Riley Reginald D and Smith Riley Cassandra D
Current Estimated Value
Home Financials for this Owner
Home Financials are based on the most recent Mortgage that was taken out on this home.
Original Mortgage
$142,200
Outstanding Balance
$65,717
Interest Rate
5.62%
Mortgage Type
Unknown
Estimated Equity
$190,782
Purchase Details
Closed on
Jan 23, 2003
Sold by
Riley Reginald and Riley Cassandra
Bought by
Smith Riley Cassandra D
Home Financials for this Owner
Home Financials are based on the most recent Mortgage that was taken out on this home.
Original Mortgage
$120,000
Interest Rate
6.01%
Purchase Details
Closed on
Sep 23, 1993
Sold by
Bodkins David B and Bodkins Deborah J
Bought by
Riley Reginald and Riley Cassandra
Home Financials for this Owner
Home Financials are based on the most recent Mortgage that was taken out on this home.
Original Mortgage
$80,803
Interest Rate
7.15%
Mortgage Type
FHA
Create a Home Valuation Report for This Property
The Home Valuation Report is an in-depth analysis detailing your home's value as well as a comparison with similar homes in the area
Home Values in the Area
Average Home Value in this Area
Purchase History
| Date | Buyer | Sale Price | Title Company |
|---|---|---|---|
| Riley Reginald D | -- | Ticor Title | |
| Smith Riley Cassandra D | -- | Ticor Title Insurance Compan | |
| Riley Reginald | $54,000 | -- |
Source: Public Records
Mortgage History
| Date | Status | Borrower | Loan Amount |
|---|---|---|---|
| Open | Riley Reginald D | $142,200 | |
| Closed | Smith Riley Cassandra D | $120,000 | |
| Closed | Riley Reginald | $80,803 |
Source: Public Records
Tax History
| Year | Tax Paid | Tax Assessment Tax Assessment Total Assessment is a certain percentage of the fair market value that is determined by local assessors to be the total taxable value of land and additions on the property. | Land | Improvement |
|---|---|---|---|---|
| 2025 | $5,585 | $19,092 | $3,685 | $15,407 |
| 2024 | $5,585 | $19,092 | $3,685 | $15,407 |
| 2023 | $3,936 | $20,000 | $3,685 | $16,315 |
| 2022 | $3,936 | $12,914 | $2,680 | $10,234 |
| 2021 | $4,224 | $14,091 | $2,680 | $11,411 |
| 2020 | $4,453 | $14,796 | $2,680 | $12,116 |
| 2019 | $2,893 | $10,251 | $2,512 | $7,739 |
| 2018 | $2,892 | $10,251 | $2,512 | $7,739 |
| 2017 | $3,333 | $11,349 | $2,512 | $8,837 |
| 2016 | $2,452 | $8,091 | $2,345 | $5,746 |
| 2015 | $3,218 | $10,053 | $2,345 | $7,708 |
| 2014 | $2,391 | $10,053 | $2,345 | $7,708 |
| 2013 | $3,641 | $11,937 | $2,345 | $9,592 |
Source: Public Records
Map
Nearby Homes
- 2316 S 10th Ave
- 2218 S 11th Ave
- 2114 S 10th Ave
- 1110 W 18th St Unit GE
- 1119 W Roosevelt Rd
- 2433 S 17th Ave
- 2105 S 7th Ave
- 2510 S 17th Ave
- 2025 S 8th Ave
- 2001 S 11th Ave
- 2024 S 6th Ave
- 2036 S 15th Ave
- 2124 S 3rd Ave
- 2125 S 3rd Ave
- 1918 S 9th Ave
- 1917 S 9th Ave
- 1911 S 11th Ave
- 1914 S 8th Ave
- 1913 S 14th Ave
- 2247 S 21st Ave
- 2421 S 11th Ave
- 2413 S 11th Ave
- 2409 S 11th Ave
- 2425 S 11th Ave
- 2416 S 10th Ave
- 2420 S 10th Ave
- 2412 S 10th Ave
- 2405 S 11th Ave
- 2429 S 11th Ave
- 2424 S 10th Ave
- 2408 S 10th Ave
- 2416 S 11th Ave
- 2433 S 11th Ave
- 2401 S 11th Ave
- 2428 S 10th Ave
- 2404 S 10th Ave
- 2412 S 11th Ave
- 2420 S 11th Ave
- 2408 S 11th Ave
- 2424 S 11th Ave
Your Personal Tour Guide
Ask me questions while you tour the home.