Estimated Value: $207,000 - $216,000
--
Bed
2
Baths
1,617
Sq Ft
$130/Sq Ft
Est. Value
About This Home
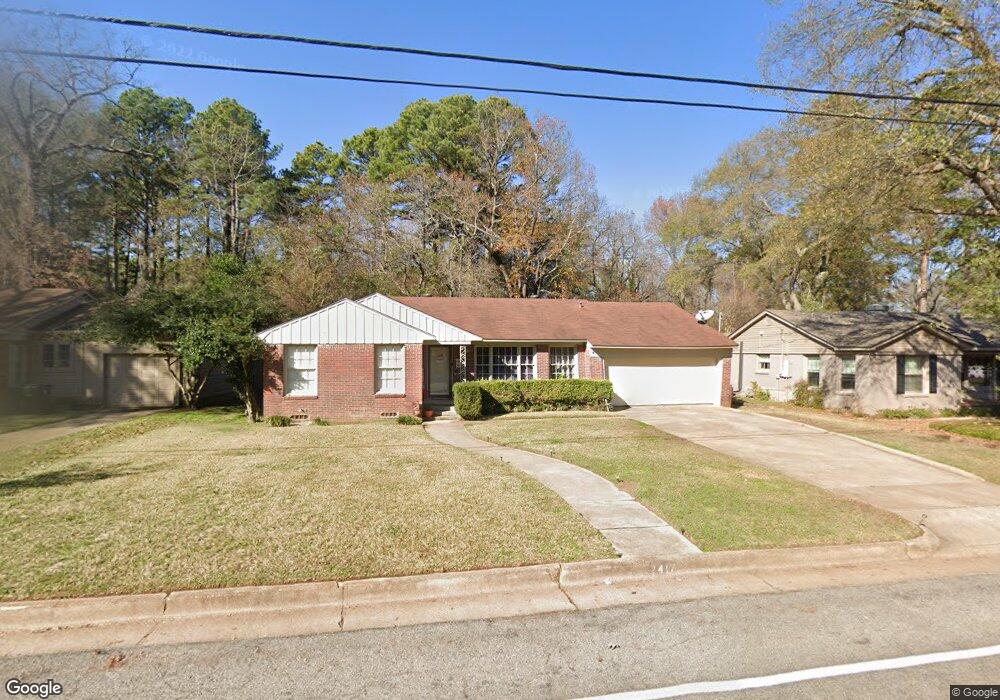
This home is located at 2417 W Azalea Dr, Tyler, TX 75701 and is currently estimated at $210,851, approximately $130 per square foot. 2417 W Azalea Dr is a home located in Smith County with nearby schools including Birdwell Dual Language Immersion School, Hogg Middle School, and Tyler Legacy High School.
Ownership History
Date
Name
Owned For
Owner Type
Purchase Details
Closed on
Aug 28, 2023
Sold by
Kalpakoff Mark and Kalpakoff Suzanne
Bought by
Kalpakoff Family Trust
Current Estimated Value
Purchase Details
Closed on
Mar 30, 2012
Sold by
Kalpakoff Mark
Bought by
Kalpakoff Mark and Kalpakoff Suzanne
Home Financials for this Owner
Home Financials are based on the most recent Mortgage that was taken out on this home.
Original Mortgage
$63,750
Interest Rate
3.97%
Mortgage Type
New Conventional
Purchase Details
Closed on
Nov 1, 2007
Sold by
Mattox Sherry A
Bought by
Kalpakoff Mark
Home Financials for this Owner
Home Financials are based on the most recent Mortgage that was taken out on this home.
Original Mortgage
$73,300
Interest Rate
6.37%
Mortgage Type
Purchase Money Mortgage
Create a Home Valuation Report for This Property
The Home Valuation Report is an in-depth analysis detailing your home's value as well as a comparison with similar homes in the area
Home Values in the Area
Average Home Value in this Area
Purchase History
| Date | Buyer | Sale Price | Title Company |
|---|---|---|---|
| Kalpakoff Family Trust | -- | None Listed On Document | |
| Kalpakoff Mark | -- | None Available | |
| Kalpakoff Mark | -- | Smith County Title Company |
Source: Public Records
Mortgage History
| Date | Status | Borrower | Loan Amount |
|---|---|---|---|
| Previous Owner | Kalpakoff Mark | $63,750 | |
| Previous Owner | Kalpakoff Mark | $73,300 |
Source: Public Records
Tax History Compared to Growth
Tax History
| Year | Tax Paid | Tax Assessment Tax Assessment Total Assessment is a certain percentage of the fair market value that is determined by local assessors to be the total taxable value of land and additions on the property. | Land | Improvement |
|---|---|---|---|---|
| 2025 | $3,487 | $219,755 | $32,367 | $187,388 |
| 2024 | $3,487 | $204,994 | $15,232 | $189,762 |
| 2023 | $2,976 | $170,742 | $15,232 | $155,510 |
| 2022 | $2,851 | $145,513 | $11,750 | $133,763 |
| 2021 | $2,156 | $102,741 | $11,750 | $90,991 |
| 2020 | $2,095 | $97,915 | $11,750 | $86,165 |
| 2019 | $1,884 | $86,167 | $8,074 | $78,093 |
| 2018 | $1,869 | $85,937 | $8,074 | $77,863 |
| 2017 | $1,835 | $85,937 | $8,074 | $77,863 |
| 2016 | $1,785 | $83,620 | $8,074 | $75,546 |
| 2015 | $1,653 | $80,385 | $8,074 | $72,311 |
| 2014 | $1,653 | $77,780 | $8,074 | $69,706 |
Source: Public Records
Map
Nearby Homes
- 1407 Dogwood St
- 1411 Dogwood St
- 1203 Dogwood St
- 1314 S Azalea Dr
- 2521 S Vine Ave
- 2525 S Vine Ave
- 1425 Dogwood St
- 2529 S Vine Ave
- 2527 S Robertson Ave
- 2715 S Robertson Ave
- 2809 S Robertson Ave
- 829 W 10th St
- 902 W 9th St
- 1209 Terre Haute Dr
- 2622 Oak Ln
- 2900 S Robertson Ave
- 1720 Outer Dr
- 1506 Bowie Dr
- 2922 W Azalea Dr
- 2864 S Robertson Ave
- 2411 W Azalea Dr
- 2421 W Azalea Dr
- 2421 2421 W Azalea
- 2421 W Azalea Dr
- 2407 W Azalea Dr
- 2429 2429 W Azalea Dr
- 2429 W Azalea Dr
- 1227 Dogwood St
- 2503 W Azalea Dr
- 1222 W Camellia St
- 2327 W Azalea Dr
- 1310 Dogwood St
- 2509 W Azalea Dr
- 1304 Dogwood St
- 1217 1217 Dogwood
- 2328 S Vine Ave
- 1215 1215 Dogwood
- 1215 Dogwood St
- 1224 Dogwood St
- 1214 W Camellia St