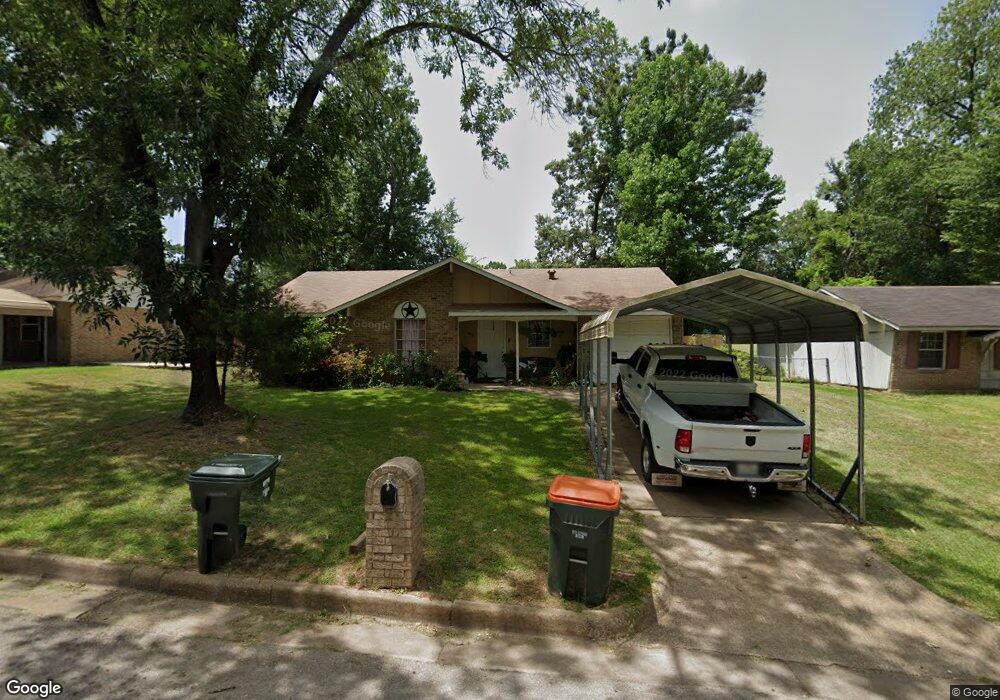
2419 2419 Pinkerton Dr Tyler, TX 75701
Midtown Tyler NeighborhoodEstimated Value: $174,408 - $189,000
--
Bed
2
Baths
1,005
Sq Ft
$180/Sq Ft
Est. Value
About This Home
This home is located at 2419 2419 Pinkerton Dr, Tyler, TX 75701 and is currently estimated at $180,852, approximately $179 per square foot. 2419 2419 Pinkerton Dr is a home located in Smith County with nearby schools including Bell Elementary School, Moore Middle School, and Tyler High School.
Ownership History
Date
Name
Owned For
Owner Type
Purchase Details
Closed on
Nov 19, 2020
Sold by
Adair Glenna Fern and Adair Bland Jannie
Bought by
Espinoza Villela Jose Luis
Current Estimated Value
Home Financials for this Owner
Home Financials are based on the most recent Mortgage that was taken out on this home.
Original Mortgage
$34,200
Outstanding Balance
$30,364
Interest Rate
2.8%
Mortgage Type
New Conventional
Estimated Equity
$150,488
Purchase Details
Closed on
Mar 28, 2014
Sold by
Davis Danny and Davis Danny Allen
Bought by
Espinoza Jose and Bonilla Anita
Home Financials for this Owner
Home Financials are based on the most recent Mortgage that was taken out on this home.
Original Mortgage
$67,500
Interest Rate
6.25%
Mortgage Type
Adjustable Rate Mortgage/ARM
Purchase Details
Closed on
Oct 21, 2009
Sold by
Mobley Robert T
Bought by
Davis Danny and Davis Freddie
Purchase Details
Closed on
Mar 12, 2009
Sold by
Mobley Robert T and Mobley Robert T
Bought by
Mobley Robert T and The Robert T Mobley Trust
Create a Home Valuation Report for This Property
The Home Valuation Report is an in-depth analysis detailing your home's value as well as a comparison with similar homes in the area
Home Values in the Area
Average Home Value in this Area
Purchase History
| Date | Buyer | Sale Price | Title Company |
|---|---|---|---|
| Espinoza Villela Jose Luis | -- | Homeland Title Recordings | |
| Espinoza Jose | -- | None Available | |
| Davis Danny | -- | None Available | |
| Mobley Robert T | -- | None Available |
Source: Public Records
Mortgage History
| Date | Status | Borrower | Loan Amount |
|---|---|---|---|
| Open | Espinoza Villela Jose Luis | $34,200 | |
| Previous Owner | Espinoza Jose | $67,500 |
Source: Public Records
Tax History Compared to Growth
Tax History
| Year | Tax Paid | Tax Assessment Tax Assessment Total Assessment is a certain percentage of the fair market value that is determined by local assessors to be the total taxable value of land and additions on the property. | Land | Improvement |
|---|---|---|---|---|
| 2025 | $2,711 | $169,699 | $33,353 | $136,346 |
| 2024 | $2,711 | $159,380 | $22,382 | $138,402 |
| 2023 | $2,315 | $132,817 | $22,382 | $110,435 |
| 2022 | $2,517 | $128,458 | $22,382 | $106,076 |
| 2021 | $1,972 | $94,006 | $14,725 | $79,281 |
| 2020 | $1,870 | $87,400 | $14,725 | $72,675 |
| 2019 | $1,863 | $85,187 | $14,725 | $70,462 |
| 2018 | $1,704 | $78,353 | $11,780 | $66,573 |
| 2017 | $1,673 | $78,353 | $11,780 | $66,573 |
| 2016 | $1,625 | $76,129 | $11,780 | $64,349 |
| 2015 | $1,174 | $73,401 | $11,780 | $61,621 |
| 2014 | $1,174 | $55,246 | $11,780 | $43,466 |
Source: Public Records
Map
Nearby Homes
- 2313 Danica Dr
- 2607 Old Henderson Hwy
- 834 S Tipton Ave
- 1919 E Ferdell St
- 1910 E Lake St
- 2750 Glascow Rd
- 1914 Parklen St
- 912 S Palmer Ave
- 837 S Palmer Ave
- 1704 E Houston St
- 1528 E Devine St
- 2015 E 5th St
- 1432 E Don St
- 2408 Hunter St
- 2331 Hunter St
- 1513 E Lawrence St
- 1715 Ridgeview Dr
- 207 Patricia Ct
- 1314 E Dawson St
- 1220 E Front St
- 2419 Pinkerton Dr
- 2425 Pinkerton Dr
- 2413 Pinkerton Dr
- 2406 Smuts Dr
- 2400 Smuts Dr
- 2407 Pinkerton Dr
- 2431 Pinkerton Dr
- 2420 Smuts Dr
- 2414 Pinkerton Dr
- 2418 Pinkerton Dr
- 2424 2424 Pinkerton
- 2326 Smuts Dr
- 2410 Pinkerton Dr
- 2424 Pinkerton Dr
- 2401 Pinkerton St
- 2401 Pinkerton Dr
- 2430 2430 Smuts
- 2430 Smuts Dr
- 2406 Pinkerton Dr
- 2500 2500 Erin