Estimated Value: $238,000 - $283,153
--
Bed
--
Bath
1,622
Sq Ft
$163/Sq Ft
Est. Value
About This Home
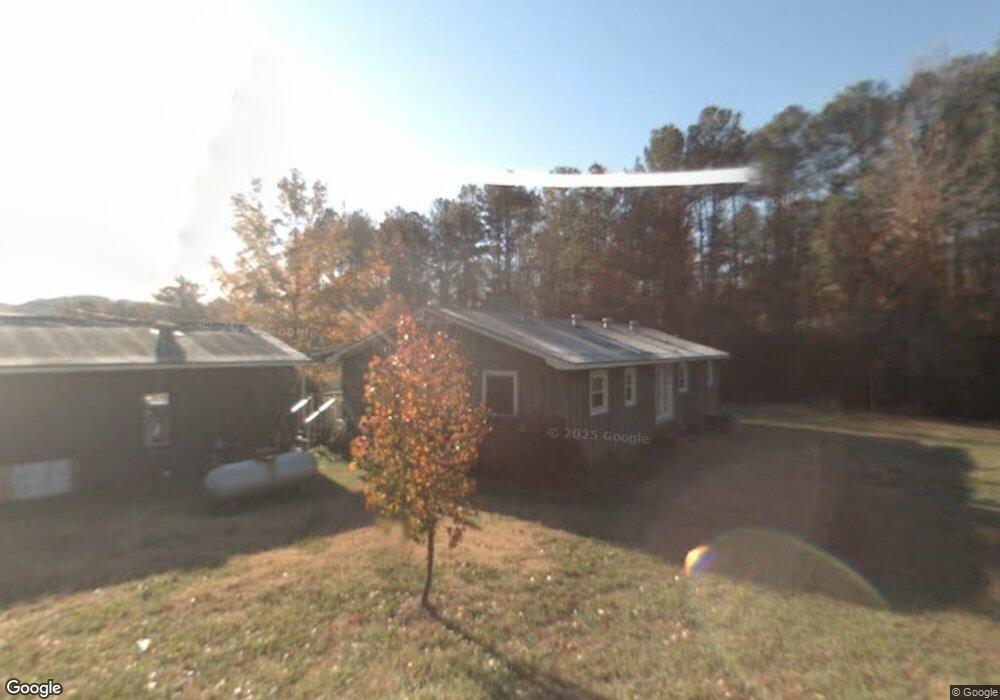
This home is located at 2419 Calhoun Rd NE, Rome, GA 30161 and is currently estimated at $265,051, approximately $163 per square foot. 2419 Calhoun Rd NE is a home located in Floyd County with nearby schools including Model Middle School, Model High School, and Unity Christian School.
Ownership History
Date
Name
Owned For
Owner Type
Purchase Details
Closed on
Nov 5, 2013
Sold by
Griffin Larry
Bought by
Griffin Kenneth W
Current Estimated Value
Purchase Details
Closed on
Nov 19, 2010
Sold by
Griffin Evelyn
Bought by
Griffin Larry
Purchase Details
Closed on
Jun 8, 1983
Sold by
Griffin Larry
Bought by
Griffin Larry and Evelyn Griffin
Purchase Details
Closed on
Mar 28, 1983
Bought by
P and R
Purchase Details
Closed on
Nov 1, 1982
Sold by
Evans Linda S and Evans Granger C
Bought by
Griffin Larry
Purchase Details
Closed on
Oct 21, 1981
Sold by
Northside Baptist Church
Bought by
Evans Linda S and Evans Granger C
Purchase Details
Closed on
Jun 30, 1980
Sold by
Ivester John D
Bought by
Northside Baptist Church
Purchase Details
Closed on
Mar 10, 1980
Sold by
Floyd Investment Co
Bought by
Ivester John D
Purchase Details
Closed on
Jan 1, 1952
Bought by
Floyd Investment Co
Create a Home Valuation Report for This Property
The Home Valuation Report is an in-depth analysis detailing your home's value as well as a comparison with similar homes in the area
Home Values in the Area
Average Home Value in this Area
Purchase History
| Date | Buyer | Sale Price | Title Company |
|---|---|---|---|
| Griffin Kenneth W | -- | -- | |
| Griffin Larry | -- | -- | |
| Griffin Larry | -- | -- | |
| Griffin Larry | -- | -- | |
| P | -- | -- | |
| Griffin Larry | $10,500 | -- | |
| Evans Linda S | $12,700 | -- | |
| Northside Baptist Church | $12,600 | -- | |
| Ivester John D | $76,800 | -- | |
| Floyd Investment Co | -- | -- |
Source: Public Records
Tax History Compared to Growth
Tax History
| Year | Tax Paid | Tax Assessment Tax Assessment Total Assessment is a certain percentage of the fair market value that is determined by local assessors to be the total taxable value of land and additions on the property. | Land | Improvement |
|---|---|---|---|---|
| 2024 | $3,015 | $97,374 | $19,114 | $78,260 |
| 2023 | $2,786 | $93,582 | $17,376 | $76,206 |
| 2022 | $2,149 | $72,415 | $14,335 | $58,080 |
| 2021 | $1,738 | $57,572 | $13,046 | $44,526 |
| 2020 | $1,655 | $54,379 | $11,345 | $43,034 |
| 2019 | $1,586 | $52,799 | $11,345 | $41,454 |
| 2018 | $1,524 | $50,644 | $10,806 | $39,838 |
| 2017 | $1,382 | $49,011 | $10,006 | $39,005 |
| 2016 | $1,384 | $48,520 | $10,000 | $38,520 |
| 2015 | $997 | $48,960 | $10,000 | $38,960 |
| 2014 | $997 | $49,400 | $10,000 | $39,400 |
Source: Public Records
Map
Nearby Homes
- 16 Maycroft Ct
- 13 Maycroft Ct
- 163 Sweet Water Ln SE
- 165 Sweet Water Ln SE
- 0 Calhoun Rd NE Unit 7516251
- 0 Calhoun Rd NE Unit 10488821
- 253 Bells Ferry Rd NE
- 153 Yale Rd NE
- 107 Whispering Pines NE
- 105 Whispering Pines NE
- 3 NE Page Dr
- 637 Wayside Rd NE
- 424 Wayside Rd NE
- 525 N River Rd NE
- 608 Wayside Rd NE
- 21 Fernwood Way NE
- 5 Larkwood Dr NE
- 0 Veterans Memorial Hwy NE Unit 10503178
- 0 Veterans Memorial Hwy NE Unit 10565194
- 0 Veterans Memorial Hwy NE Unit 9418044
- 2415 Calhoun Rd NE
- 2415 Calhoun Hwy NE
- 2425 Calhoun Rd NE
- 2429 Calhoun Rd NE
- 2435 Calhoun Rd NE
- 2435 Calhoun Rd NE
- 2427 Calhoun Rd NE
- 90 Northridge Ct NE
- 58 Northridge Ct NE
- 26 Northridge Ct NE
- 88 Northridge Ct NE
- 2445 Calhoun Rd NE
- 46 Ridge Ct N
- N Northridge Ct NE
- N Northridge Ct NE
- 0 Northridge Ct NE
- 72 Northridge Ct NE
- 2485 Calhoun Rd NE
- 9 Maycroft Ct