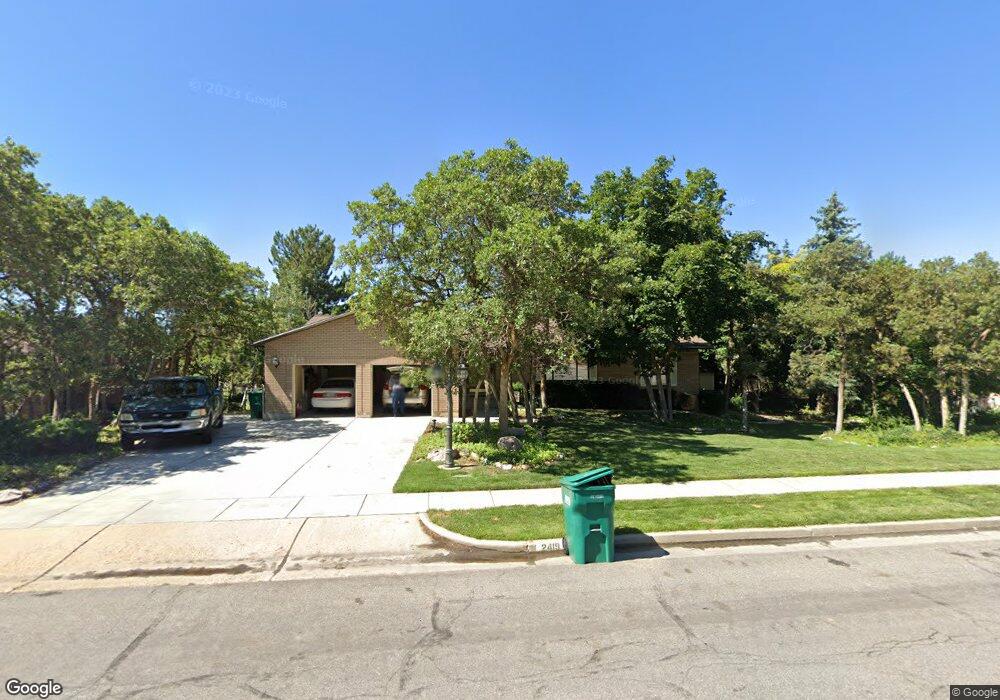
2419 Cheryle Way Layton, UT 84040
Estimated Value: $575,000 - $648,000
5
Beds
3
Baths
3,718
Sq Ft
$166/Sq Ft
Est. Value
About This Home
This home is located at 2419 Cheryle Way, Layton, UT 84040 and is currently estimated at $617,854, approximately $166 per square foot. 2419 Cheryle Way is a home located in Davis County with nearby schools including Sarah Jane Adams Elementary School, North Layton Junior High School, and Northridge High School.
Ownership History
Date
Name
Owned For
Owner Type
Purchase Details
Closed on
Aug 27, 2020
Sold by
Quist Craig M and Quist Mary J
Bought by
Quist Craig Michael and Quist Mary Johnson
Current Estimated Value
Purchase Details
Closed on
Dec 15, 2009
Sold by
Quist Craig M and Quist Mary J
Bought by
Quist Craig M and Quist Mary J
Home Financials for this Owner
Home Financials are based on the most recent Mortgage that was taken out on this home.
Original Mortgage
$100,000
Interest Rate
4.37%
Mortgage Type
Credit Line Revolving
Purchase Details
Closed on
Mar 24, 2001
Sold by
Johnson John S and Johnson Cherie C
Bought by
Quist Craig M and Quist Mary J
Home Financials for this Owner
Home Financials are based on the most recent Mortgage that was taken out on this home.
Original Mortgage
$125,000
Interest Rate
6.55%
Purchase Details
Closed on
May 20, 1997
Sold by
Weyland Leonard D and Helen Weyland M
Bought by
Johnson John S and Johnson Cherie C
Home Financials for this Owner
Home Financials are based on the most recent Mortgage that was taken out on this home.
Original Mortgage
$147,900
Interest Rate
7.87%
Create a Home Valuation Report for This Property
The Home Valuation Report is an in-depth analysis detailing your home's value as well as a comparison with similar homes in the area
Home Values in the Area
Average Home Value in this Area
Purchase History
| Date | Buyer | Sale Price | Title Company |
|---|---|---|---|
| Quist Craig Michael | -- | Accommodation | |
| Quist Craig M | -- | Accommodation | |
| Quist Craig M | -- | Bonneville Title Company Inc | |
| Johnson John S | -- | Bonneville Title Company Inc |
Source: Public Records
Mortgage History
| Date | Status | Borrower | Loan Amount |
|---|---|---|---|
| Closed | Quist Craig M | $100,000 | |
| Previous Owner | Quist Craig M | $125,000 | |
| Previous Owner | Johnson John S | $147,900 |
Source: Public Records
Tax History
| Year | Tax Paid | Tax Assessment Tax Assessment Total Assessment is a certain percentage of the fair market value that is determined by local assessors to be the total taxable value of land and additions on the property. | Land | Improvement |
|---|---|---|---|---|
| 2025 | $3,317 | $320,100 | $139,423 | $180,677 |
| 2024 | $3,146 | $308,000 | $160,455 | $147,545 |
| 2023 | $3,188 | $557,000 | $210,609 | $346,391 |
| 2022 | $3,307 | $315,700 | $113,469 | $202,231 |
| 2021 | $2,913 | $413,000 | $173,490 | $239,510 |
| 2020 | $2,660 | $361,000 | $143,698 | $217,302 |
| 2019 | $2,603 | $348,000 | $127,664 | $220,336 |
| 2018 | $2,420 | $325,000 | $101,925 | $223,075 |
| 2016 | $2,191 | $154,275 | $53,112 | $101,163 |
| 2015 | $2,166 | $145,805 | $53,112 | $92,693 |
| 2014 | $1,999 | $138,245 | $53,112 | $85,133 |
| 2013 | -- | $131,924 | $34,213 | $97,711 |
Source: Public Records
Map
Nearby Homes
- 2563 E 2250 N
- 2597 N 2300 E
- 2136 N 2800 E
- 2569 N 2900 E
- 2340 N 2050 E
- 1954 N 2600 E
- 2547 E 1900 N
- 2509 E 1900 N
- 2353 Canyon View Dr
- 2273 N 1975 E
- 1907 N Bridge Ct
- 2189 N 1950 E
- 2391 Kays Creek Dr
- 1935 Deere Valley Dr
- 1911 Deere Valley Dr
- 1785 E 2825 N
- 3142 E Thorley Dr
- 3138 E Thorley Dr
- 1731 E 2825 N
- 3232 N Redtail Way
- 2437 Cheryle Way
- 2401 Cheryle Way
- 2368 Raelyn Way
- 2374 Raelyn Way
- 2438 Cheryle Way
- 2360 Raelyn Way
- 2450 Cheryle Way
- 2453 Cheryle Way
- 2420 Cheryle Way
- 2383 Cheryle Way
- 2408 Raelyn Way
- 2352 Raelyn Way
- 2456 Cheryle Way
- 2437 N 2550 E
- 2402 Cheryle Way
- 2377 Raelyn Way
- 2467 Cheryle Way
- 2455 N 2550 E
- 2357 Raelyn Way
- 2419 N 2550 E
Your Personal Tour Guide
Ask me questions while you tour the home.