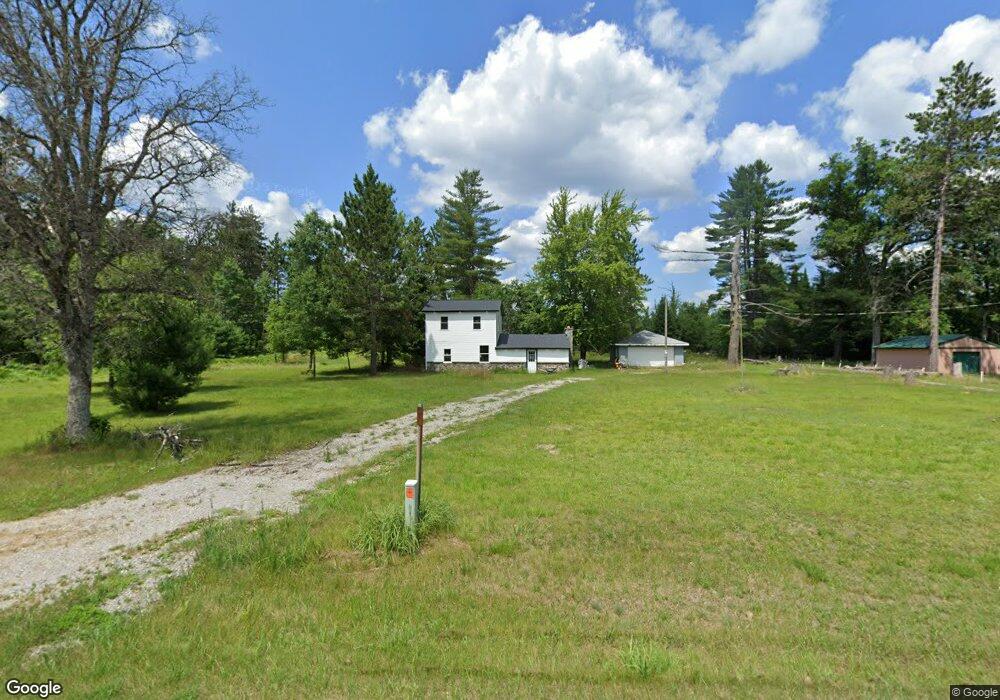
2419 E North Down River Rd Grayling, MI 49738
Estimated Value: $144,000 - $219,000
1
Bed
1
Bath
708
Sq Ft
$236/Sq Ft
Est. Value
About This Home
This home is located at 2419 E North Down River Rd, Grayling, MI 49738 and is currently estimated at $167,011, approximately $235 per square foot. 2419 E North Down River Rd is a home located in Crawford County with nearby schools including Grayling Elementary School, Grayling Middle School, and Grayling High School.
Ownership History
Date
Name
Owned For
Owner Type
Purchase Details
Closed on
Dec 10, 2021
Sold by
Middleton Pamela
Bought by
Strachan Montgomery Dustin
Current Estimated Value
Purchase Details
Closed on
Sep 24, 2020
Sold by
Gk & Gm Llc
Bought by
Gk Spectrum Llc
Purchase Details
Closed on
Jul 26, 2012
Sold by
Mastroeni Geno
Bought by
Gk & Gm Llc
Purchase Details
Closed on
Nov 17, 2005
Sold by
Lamotte Duane and Lamotte Brenda
Bought by
Middleton William L and Middleton Pamela
Purchase Details
Closed on
Oct 17, 2003
Sold by
Smith Aaron Lavelle
Bought by
Middleton William
Purchase Details
Closed on
Oct 4, 2003
Sold by
Smith Aaron L
Bought by
Lamotte Duane and Lamotte Brenda
Purchase Details
Closed on
Apr 19, 1997
Sold by
Osborne Robert L and Osborne Betty
Bought by
Lamotte Duane and Wf Brenda
Purchase Details
Closed on
Apr 1, 1997
Sold by
Lamotte Duane and Lamotte Brenda
Bought by
Smith Aaron Lavelle
Create a Home Valuation Report for This Property
The Home Valuation Report is an in-depth analysis detailing your home's value as well as a comparison with similar homes in the area
Home Values in the Area
Average Home Value in this Area
Purchase History
| Date | Buyer | Sale Price | Title Company |
|---|---|---|---|
| Strachan Montgomery Dustin | -- | -- | |
| Middleton Pamela J | $39,900 | -- | |
| Gk Spectrum Llc | -- | -- | |
| Gk & Gm Llc | -- | -- | |
| Middleton William L | -- | -- | |
| Middleton William | $33,000 | -- | |
| Lamotte Duane | -- | -- | |
| Lamotte Duane | $33,000 | -- | |
| Smith Aaron Lavelle | $33,500 | -- | |
| Smith Aaron Lavelle | $33,500 | -- |
Source: Public Records
Tax History
| Year | Tax Paid | Tax Assessment Tax Assessment Total Assessment is a certain percentage of the fair market value that is determined by local assessors to be the total taxable value of land and additions on the property. | Land | Improvement |
|---|---|---|---|---|
| 2025 | $1,680 | $58,700 | $1,800 | $56,900 |
| 2024 | $1,647 | $56,300 | $1,800 | $54,500 |
| 2023 | $1,086 | $33,800 | $1,800 | $32,000 |
| 2022 | $499 | $29,400 | $1,800 | $27,600 |
| 2021 | $589 | $27,200 | $1,800 | $25,400 |
| 2020 | $582 | $26,500 | $1,800 | $24,700 |
| 2019 | $570 | $22,600 | $1,800 | $20,800 |
| 2018 | $560 | $21,600 | $1,800 | $19,800 |
| 2017 | $368 | $23,600 | $1,800 | $21,800 |
| 2016 | $359 | $18,700 | $1,800 | $16,900 |
| 2015 | $829 | $18,700 | $0 | $0 |
| 2014 | -- | $17,500 | $0 | $0 |
| 2013 | -- | $17,300 | $0 | $0 |
Source: Public Records
Map
Nearby Homes
- 0 Fiddlewood Dr
- 108 S Bauman Rd
- 1460 E North Down River Rd
- 0 N Wakeley Bridge Rd Unit 201828736
- 1486 S Stephan Bridge Rd
- 2969 Cambay Trail
- 2741 E M 72 Hwy
- 2741 E M-72 Hwy
- 2762 S Horseshoe Trail
- 351 Michigan 72
- 2045 Mccarty Dr
- 3048 S Wakeley Bridge Rd
- 0000 E North Down River Rd
- 3358 S Stephan Bridge Rd
- 00 E North Down River Rd
- 2706 Newatch Ave
- 2698 Newatch Ave
- 269 W Timber Trail
- Lot 82 Evelyn Ave
- 3866 Wintergreen Ln
- 2461 E North Down River Rd
- 2461 E North Down River Rd
- 2481 E North Down River Rd
- 2365 E North Down River Rd
- 2367 E North Down River Rd
- 2418 E North Down River Rd
- 2527 E North Down River Rd
- 2618 E North Down River Rd
- 170 N Spite Ave
- 2553 E North Down River Rd
- 69 N Spite Ave
- 0 N Spite Ave Unit 7.55 acres 307214
- 0 N Spite Ave Unit 20 ACRES 299363
- 0 N Spite Ave Unit 287173
- 0 N Spite Ave Unit 20 ACRES 282947
- 0 N Spite Ave Unit 78080019660
- 0 N Spite Ave Unit 78080020530
- 0 N Spite Ave Unit Parcel C - 3.35 acre
- 0 N Spite Ave Unit 201826985
- 0 N Spite Ave Unit 315792
Your Personal Tour Guide
Ask me questions while you tour the home.