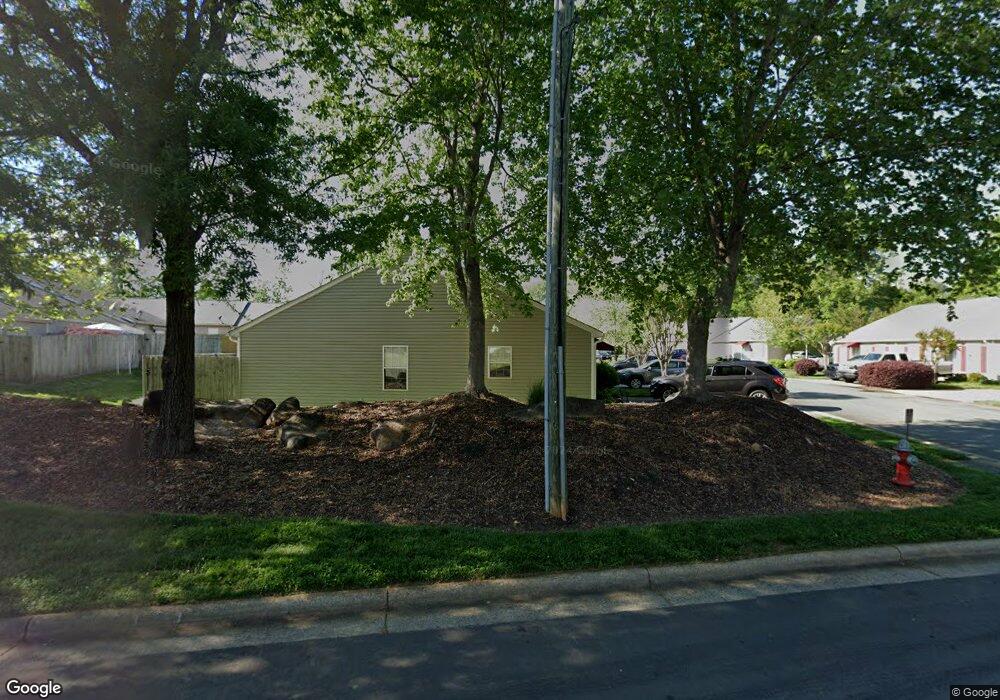
2419 Moran St Unit A Burlington, NC 27215
West Burlington NeighborhoodEstimated Value: $170,000 - $178,000
2
Beds
2
Baths
1,107
Sq Ft
$156/Sq Ft
Est. Value
About This Home
This home is located at 2419 Moran St Unit A, Burlington, NC 27215 and is currently estimated at $172,949, approximately $156 per square foot. 2419 Moran St Unit A is a home located in Alamance County with nearby schools including Grove Park Elementary School, Graham Middle School, and Graham High School.
Ownership History
Date
Name
Owned For
Owner Type
Purchase Details
Closed on
May 12, 2014
Sold by
Secretary Of U H D Washington
Bought by
Mass Family Of Graham
Current Estimated Value
Purchase Details
Closed on
Sep 17, 2013
Sold by
Sub Tr Services Inc Sub Tr and Perkins Penny
Bought by
Secretary Of Hud Washington Dc
Purchase Details
Closed on
Jun 29, 2012
Sold by
Jenkins Tony W
Bought by
Perkins Penny
Home Financials for this Owner
Home Financials are based on the most recent Mortgage that was taken out on this home.
Original Mortgage
$86,896
Interest Rate
3.75%
Mortgage Type
FHA
Purchase Details
Closed on
Nov 20, 2003
Sold by
K B K Of North Carolina L
Bought by
Jenkins Tony
Home Financials for this Owner
Home Financials are based on the most recent Mortgage that was taken out on this home.
Original Mortgage
$76,000
Interest Rate
5.93%
Mortgage Type
New Conventional
Create a Home Valuation Report for This Property
The Home Valuation Report is an in-depth analysis detailing your home's value as well as a comparison with similar homes in the area
Home Values in the Area
Average Home Value in this Area
Purchase History
| Date | Buyer | Sale Price | Title Company |
|---|---|---|---|
| Mass Family Of Graham | -- | -- | |
| Secretary Of Hud Washington Dc | $55,440 | -- | |
| Perkins Penny | $89,000 | -- | |
| Jenkins Tony | $85,000 | -- |
Source: Public Records
Mortgage History
| Date | Status | Borrower | Loan Amount |
|---|---|---|---|
| Previous Owner | Perkins Penny | $86,896 | |
| Previous Owner | Jenkins Tony | $76,000 |
Source: Public Records
Tax History Compared to Growth
Tax History
| Year | Tax Paid | Tax Assessment Tax Assessment Total Assessment is a certain percentage of the fair market value that is determined by local assessors to be the total taxable value of land and additions on the property. | Land | Improvement |
|---|---|---|---|---|
| 2025 | $871 | $176,289 | $20,000 | $156,289 |
| 2024 | $827 | $176,289 | $20,000 | $156,289 |
| 2023 | $1,606 | $176,289 | $20,000 | $156,289 |
| 2022 | $990 | $79,809 | $10,000 | $69,809 |
| 2021 | $998 | $79,809 | $10,000 | $69,809 |
| 2020 | $1,006 | $79,809 | $10,000 | $69,809 |
| 2019 | $1,009 | $79,809 | $10,000 | $69,809 |
| 2018 | $474 | $79,809 | $10,000 | $69,809 |
| 2017 | $461 | $79,809 | $10,000 | $69,809 |
| 2016 | $1,012 | $87,274 | $10,000 | $77,274 |
| 2015 | -- | $87,274 | $10,000 | $77,274 |
| 2014 | -- | $87,274 | $10,000 | $77,274 |
Source: Public Records
Map
Nearby Homes
- 2005 Rendall St
- 2202 Huntington Rd Unit C4
- 823 Cornwallis Dr
- 903 Hahn Rd
- 1917 Tucker St
- 813 Lynnwood Dr
- 702 Trail One
- 200 Trail Two
- 2702 Kingsbury Ct
- 2521 Saintsbury Dr
- 825 Parkwood St
- 118 Tarleton Ave
- 2923 & 2925 Trail Six
- 2272 May Dr
- 0 Hillside Dr
- 1326 S Church St
- 514 Country Club Dr
- 1304 S Church St
- 3012 S Mebane St
- 735 Everett St
- 2419A Moran St
- 2419 Moran St
- 2419 Moran St Unit C
- 2419B Moran St
- 2421C Moran St
- 2421-C Moran St
- 2419C Moran St
- 2425A Moran St
- 2421B Moran St
- 2425B Moran St
- 2421 Moran St Unit A
- 2421A Moran St
- 2421 Moran St Unit C
- 2421 Moran St Unit B
- 2421 Moran St
- 2423A Moran St
- 2423 Moran St Unit A
- 2423 Moran St Unit C
- 2423 Moran St
- 2413C Moran St