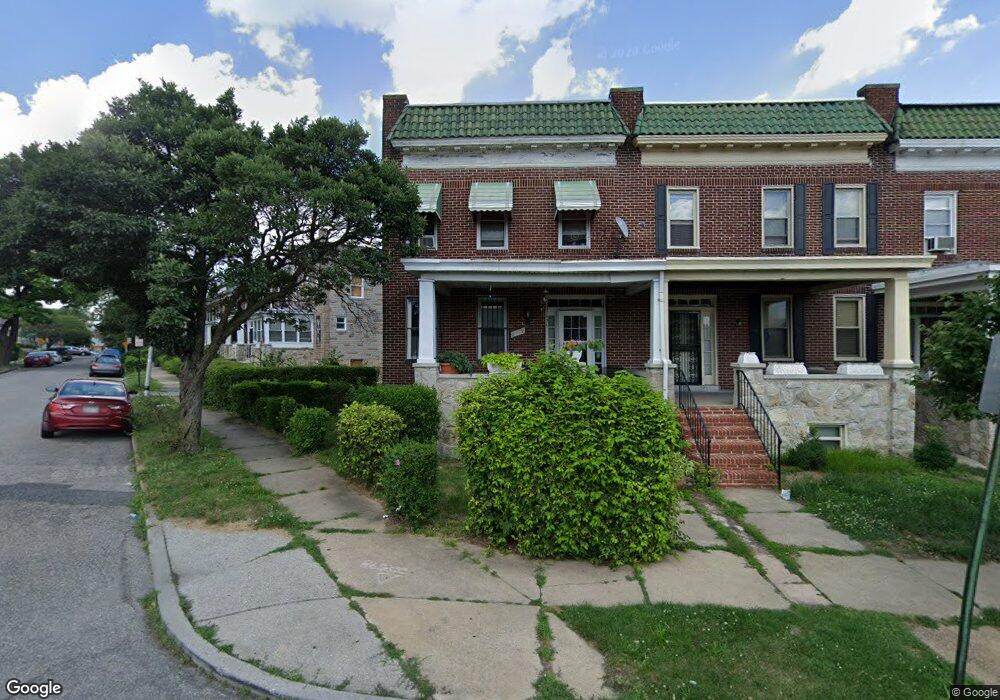
2419 N Pulaski St Baltimore, MD 21217
Mondawmin NeighborhoodEstimated Value: $130,000 - $199,888
--
Bed
1
Bath
1,592
Sq Ft
$104/Sq Ft
Est. Value
About This Home
This home is located at 2419 N Pulaski St, Baltimore, MD 21217 and is currently estimated at $164,944, approximately $103 per square foot. 2419 N Pulaski St is a home located in Baltimore City with nearby schools including Robert W. Coleman Elementary School, Booker T. Washington Middle School, and Frederick Douglass High School.
Ownership History
Date
Name
Owned For
Owner Type
Purchase Details
Closed on
Nov 1, 2019
Sold by
Jackson Carol A
Bought by
Jackson Carol A and Mcdonald Tia Danielle
Current Estimated Value
Purchase Details
Closed on
Jun 18, 2004
Sold by
Copel Melissa
Bought by
Jackson Carol A
Purchase Details
Closed on
Jun 23, 1999
Sold by
Pitt William P
Bought by
Copeland Melissa
Purchase Details
Closed on
Jan 24, 1996
Sold by
Powell Michael
Bought by
Pitt William P and Pitt Talisha M
Purchase Details
Closed on
Apr 14, 1995
Sold by
Alliance Mtg Co
Bought by
Powell Michael
Home Financials for this Owner
Home Financials are based on the most recent Mortgage that was taken out on this home.
Original Mortgage
$10,000
Interest Rate
8.49%
Purchase Details
Closed on
Aug 18, 1994
Sold by
Dunlap Theodore
Bought by
Alliance Mtge Company
Create a Home Valuation Report for This Property
The Home Valuation Report is an in-depth analysis detailing your home's value as well as a comparison with similar homes in the area
Home Values in the Area
Average Home Value in this Area
Purchase History
| Date | Buyer | Sale Price | Title Company |
|---|---|---|---|
| Jackson Carol A | -- | None Available | |
| Jackson Carol A | $74,000 | -- | |
| Copeland Melissa | $65,000 | -- | |
| Pitt William P | $64,500 | -- | |
| Powell Michael | $15,500 | -- | |
| Alliance Mtge Company | $36,125 | -- |
Source: Public Records
Mortgage History
| Date | Status | Borrower | Loan Amount |
|---|---|---|---|
| Previous Owner | Alliance Mtge Company | $10,000 |
Source: Public Records
Tax History Compared to Growth
Tax History
| Year | Tax Paid | Tax Assessment Tax Assessment Total Assessment is a certain percentage of the fair market value that is determined by local assessors to be the total taxable value of land and additions on the property. | Land | Improvement |
|---|---|---|---|---|
| 2025 | $2,291 | $141,700 | $14,000 | $127,700 |
| 2024 | $2,291 | $128,667 | $0 | $0 |
| 2023 | $2,173 | $115,633 | $0 | $0 |
| 2022 | $2,176 | $102,600 | $14,000 | $88,600 |
| 2021 | $2,421 | $102,600 | $14,000 | $88,600 |
| 2020 | $2,171 | $102,600 | $14,000 | $88,600 |
| 2019 | $2,199 | $104,500 | $14,000 | $90,500 |
| 2018 | $2,234 | $104,467 | $0 | $0 |
| 2017 | $2,173 | $104,433 | $0 | $0 |
| 2016 | $1,894 | $104,400 | $0 | $0 |
| 2015 | $1,894 | $101,267 | $0 | $0 |
| 2014 | $1,894 | $98,133 | $0 | $0 |
Source: Public Records
Map
Nearby Homes
- 1901 Gwynns Falls Pkwy
- 2418 Reisterstown Rd
- 2430 Reisterstown Rd
- 2413 Reisterstown Rd
- 2519 Reisterstown Rd
- 2214 N Monroe St
- 3400 Woodbrook Ave
- 2113 N Pulaski St
- 2218 Ruskin Ave
- 2301 Whittier Ave
- 2213 Ruskin Ave
- 2228 Ruskin Ave
- 2880 Woodbrook Ave
- 2028 N Payson St
- 2100 N Smallwood St
- 2202 Clifton Ave
- 2869 Woodbrook Ave
- 2013 N Payson St
- 2857 Woodbrook Ave
- 1936 Ridgehill Ave
- 2417 N Pulaski St
- 2415 N Pulaski St
- 2001 Bryant Ave
- 2413 N Pulaski St
- 2003 Bryant Ave
- 2000 Whittier Ave
- 2411 N Pulaski St
- 2005 Bryant Ave
- 2000 Bryant Ave
- 2002 Whittier Ave
- 2007 Bryant Ave
- 2004 Whittier Ave
- 2002 Bryant Ave
- 2009 Bryant Ave
- 2006 Whittier Ave
- 2004 Bryant Ave
- 2008 Whittier Ave
- 2011 Bryant Ave
- 2006 Bryant Ave
- 2010 Whittier Ave