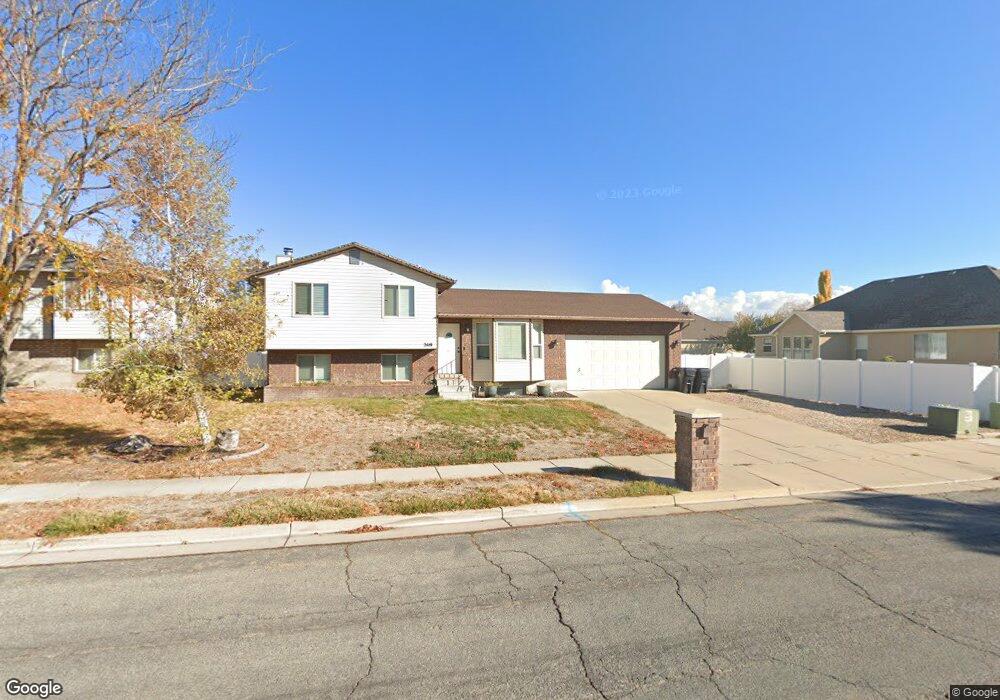
2419 S 1800 W Syracuse, UT 84075
Estimated Value: $416,000 - $473,000
4
Beds
2
Baths
1,960
Sq Ft
$230/Sq Ft
Est. Value
About This Home
This home is located at 2419 S 1800 W, Syracuse, UT 84075 and is currently estimated at $450,334, approximately $229 per square foot. 2419 S 1800 W is a home located in Davis County with nearby schools including Syracuse Elementary School, Syracuse Junior High School, and Syracuse High School.
Ownership History
Date
Name
Owned For
Owner Type
Purchase Details
Closed on
Jul 29, 2020
Sold by
Limb Trent
Bought by
Limb Trent and Limb Lindsey
Current Estimated Value
Home Financials for this Owner
Home Financials are based on the most recent Mortgage that was taken out on this home.
Original Mortgage
$185,470
Outstanding Balance
$164,463
Interest Rate
3.1%
Mortgage Type
New Conventional
Estimated Equity
$285,872
Purchase Details
Closed on
Feb 7, 2018
Sold by
Limb Trent A
Bought by
Limb Trent A and Limb Lindsey R
Home Financials for this Owner
Home Financials are based on the most recent Mortgage that was taken out on this home.
Original Mortgage
$185,500
Interest Rate
3.99%
Mortgage Type
New Conventional
Purchase Details
Closed on
Sep 15, 2009
Sold by
Shradley Casey and Shradley Jodi
Bought by
Flink Matthew J and Flink Maryann B
Home Financials for this Owner
Home Financials are based on the most recent Mortgage that was taken out on this home.
Original Mortgage
$152,010
Interest Rate
5.25%
Mortgage Type
New Conventional
Create a Home Valuation Report for This Property
The Home Valuation Report is an in-depth analysis detailing your home's value as well as a comparison with similar homes in the area
Home Values in the Area
Average Home Value in this Area
Purchase History
| Date | Buyer | Sale Price | Title Company |
|---|---|---|---|
| Limb Trent | -- | Silver Leaf Title Insu | |
| Limb Trent | -- | Silver Leaf Title Insur | |
| Limb Trent A | -- | Cottonwood Title | |
| Limb Trent A | -- | Cottonwood Title | |
| Flink Matthew J | -- | First American Title |
Source: Public Records
Mortgage History
| Date | Status | Borrower | Loan Amount |
|---|---|---|---|
| Open | Limb Trent | $185,470 | |
| Closed | Limb Trent A | $185,500 | |
| Closed | Flink Matthew J | $152,010 |
Source: Public Records
Tax History Compared to Growth
Tax History
| Year | Tax Paid | Tax Assessment Tax Assessment Total Assessment is a certain percentage of the fair market value that is determined by local assessors to be the total taxable value of land and additions on the property. | Land | Improvement |
|---|---|---|---|---|
| 2025 | $2,417 | $233,200 | $121,297 | $111,903 |
| 2024 | $2,316 | $224,950 | $96,942 | $128,008 |
| 2023 | $2,158 | $382,000 | $135,267 | $246,733 |
| 2022 | $2,313 | $224,400 | $78,323 | $146,077 |
| 2021 | $2,064 | $310,000 | $115,365 | $194,635 |
| 2020 | $1,809 | $263,000 | $102,184 | $160,816 |
| 2019 | $1,714 | $246,000 | $97,820 | $148,180 |
| 2018 | $1,586 | $226,000 | $95,575 | $130,425 |
| 2016 | $1,462 | $109,230 | $36,759 | $72,471 |
| 2015 | $1,322 | $94,050 | $36,759 | $57,291 |
| 2014 | $1,243 | $90,183 | $36,759 | $53,424 |
| 2013 | -- | $83,795 | $28,694 | $55,101 |
Source: Public Records
Map
Nearby Homes
- 1836 W 2400 S
- 2503 S 1875 W
- 2194 S 1800 W
- 2208 W 2615 S Unit 141
- 2198 W 2615 S Unit 140
- 2158 W 2615 S Unit 137
- 2082 S 1730 W
- 2744 S Allison Way Unit 211
- 2742 S Allison Way Unit 212
- 2463 S 1375 W
- 1697 W 2770 S Unit 202
- 1695 W 2770 S Unit 203
- 1667 W 2770 S Unit 206
- 2650 S 2000 W
- 2000 S 1800 W
- 2104 W 2200 S
- 2223 S Allison Way
- 2047 S 2000 W
- 1315 W 2325 S
- 1295 W 2325 S