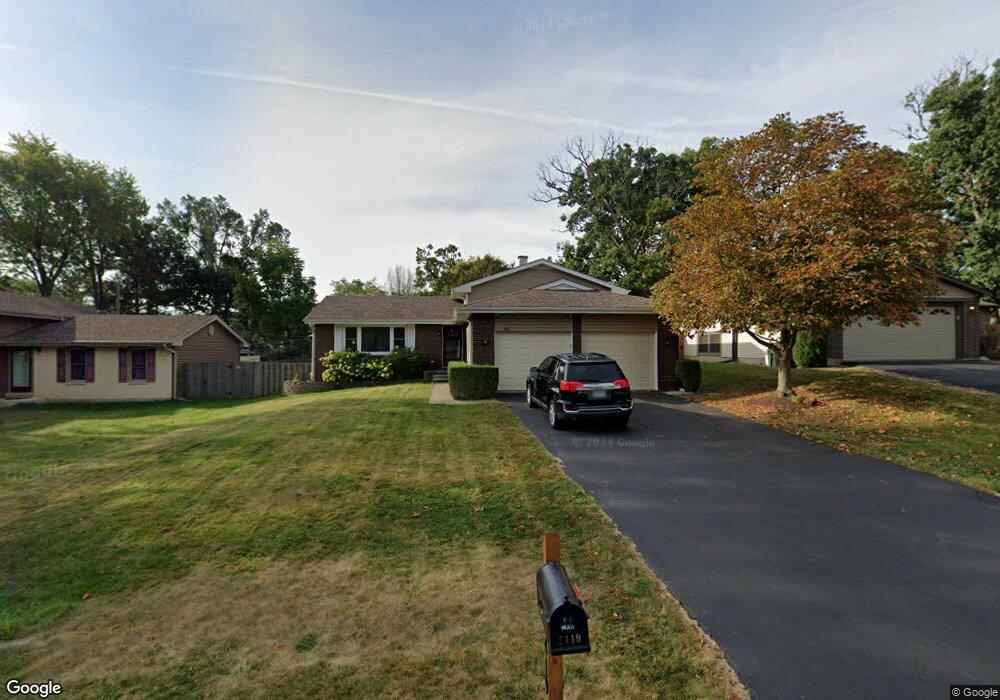
2419 Sunset Dr Lindenhurst, IL 60046
Estimated Value: $314,000 - $322,000
3
Beds
3
Baths
1,344
Sq Ft
$237/Sq Ft
Est. Value
About This Home
This home is located at 2419 Sunset Dr, Lindenhurst, IL 60046 and is currently estimated at $318,526, approximately $236 per square foot. 2419 Sunset Dr is a home located in Lake County with nearby schools including B.J. Hooper Elementary School, Palombi Middle School, and Lakes Community High School.
Ownership History
Date
Name
Owned For
Owner Type
Purchase Details
Closed on
Jun 6, 2018
Sold by
Wold Terence L and Wold Tracey F
Bought by
Michelle Swchuk Robert and Michelle Swchuk
Current Estimated Value
Home Financials for this Owner
Home Financials are based on the most recent Mortgage that was taken out on this home.
Original Mortgage
$156,000
Outstanding Balance
$137,105
Interest Rate
5.25%
Mortgage Type
New Conventional
Estimated Equity
$181,421
Purchase Details
Closed on
Jul 30, 1999
Sold by
Davila Claudia M
Bought by
Wold Terence L and Wold Tracey F
Home Financials for this Owner
Home Financials are based on the most recent Mortgage that was taken out on this home.
Original Mortgage
$151,534
Interest Rate
8.21%
Mortgage Type
FHA
Purchase Details
Closed on
Jan 14, 1994
Sold by
Washburn Elroy H and Washburn Jannie M
Bought by
Davila Claudia M
Home Financials for this Owner
Home Financials are based on the most recent Mortgage that was taken out on this home.
Original Mortgage
$107,000
Interest Rate
7.26%
Create a Home Valuation Report for This Property
The Home Valuation Report is an in-depth analysis detailing your home's value as well as a comparison with similar homes in the area
Home Values in the Area
Average Home Value in this Area
Purchase History
| Date | Buyer | Sale Price | Title Company |
|---|---|---|---|
| Michelle Swchuk Robert | $195,000 | Chicago Title Company | |
| Wold Terence L | $156,000 | -- | |
| Davila Claudia M | $89,333 | -- |
Source: Public Records
Mortgage History
| Date | Status | Borrower | Loan Amount |
|---|---|---|---|
| Open | Michelle Swchuk Robert | $156,000 | |
| Previous Owner | Wold Terence L | $151,534 | |
| Previous Owner | Davila Claudia M | $107,000 |
Source: Public Records
Tax History
| Year | Tax Paid | Tax Assessment Tax Assessment Total Assessment is a certain percentage of the fair market value that is determined by local assessors to be the total taxable value of land and additions on the property. | Land | Improvement |
|---|---|---|---|---|
| 2024 | $7,190 | $87,230 | $12,154 | $75,076 |
| 2023 | $7,555 | $77,072 | $10,739 | $66,333 |
| 2022 | $7,555 | $76,416 | $9,504 | $66,912 |
| 2021 | $7,165 | $70,986 | $8,829 | $62,157 |
| 2020 | $7,005 | $68,712 | $8,546 | $60,166 |
| 2019 | $7,551 | $66,037 | $8,213 | $57,824 |
| 2018 | $6,741 | $62,374 | $11,555 | $50,819 |
| 2017 | $6,522 | $60,711 | $11,247 | $49,464 |
| 2016 | $6,589 | $58,253 | $10,792 | $47,461 |
| 2015 | $6,330 | $54,406 | $10,079 | $44,327 |
| 2014 | $6,610 | $53,124 | $10,126 | $42,998 |
| 2012 | $6,105 | $61,315 | $11,330 | $49,985 |
Source: Public Records
Map
Nearby Homes
- 200 S Beck Rd Unit 12
- 2407 Valley Dr
- 73 S Beck Rd
- 2022 Woodlane Dr
- 961 Sumac Ct
- 2375 Kelsey Ct
- 817 Blue Spruce Ct
- 710 Greenbriar Ln
- 2711 Neubauer Cir Unit 336
- 2303 Neubauer Cir Unit 312
- 37544 N Columbus Ave
- 2792 Spring Cir S
- 2798 Spring Cir S
- 2813 Spring Cir S
- 3210 Neubauer Cir
- 206 Neubauer Cir Unit 1601
- 402 Neubauer Cir
- 1406 Neubauer Cir Unit 1904
- 1906 Fairfield Rd
- 1811 Longmeadow Dr Unit 17
- 2419 Sunset Ln
- 2421 Sunset Ln
- 2417 Sunset Ln
- 2421 Sunset Dr
- 2417 Sunset Dr
- 2420 E Thornwood Dr
- 2423 Sunset Dr
- 2415 Sunset Dr
- 2422 E Thornwood Dr
- 2416 E Thornwood Dr
- 2418 Sunset Ln
- 2418 Sunset Dr
- 242 Bonner Ln
- 2413 Sunset Ln
- 2413 Sunset Dr
- 2412 Sunset Dr
- 2412 Sunset Ln
- 2501 Bonner Ln
- 2414 E Thornwood Dr
- 2411 Sunset Dr
Your Personal Tour Guide
Ask me questions while you tour the home.