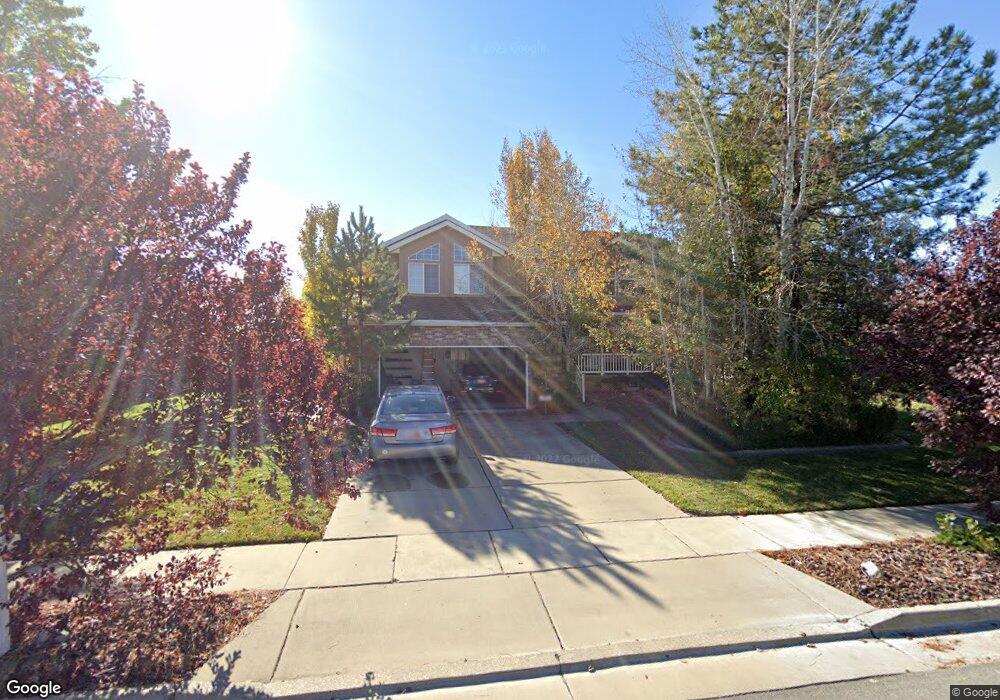
2419 W 1500 S Syracuse, UT 84075
Estimated Value: $542,124 - $714,000
5
Beds
3
Baths
2,254
Sq Ft
$281/Sq Ft
Est. Value
About This Home
This home is located at 2419 W 1500 S, Syracuse, UT 84075 and is currently estimated at $634,031, approximately $281 per square foot. 2419 W 1500 S is a home located in Davis County with nearby schools including Syracuse Elementary School, Syracuse Junior High School, and Syracuse High School.
Ownership History
Date
Name
Owned For
Owner Type
Purchase Details
Closed on
Mar 12, 2021
Sold by
Christensen Paul E
Bought by
Christensen Paul E and Christensen Paul E
Current Estimated Value
Home Financials for this Owner
Home Financials are based on the most recent Mortgage that was taken out on this home.
Original Mortgage
$132,235
Outstanding Balance
$118,270
Interest Rate
2.7%
Mortgage Type
New Conventional
Estimated Equity
$515,761
Purchase Details
Closed on
Jun 4, 2014
Sold by
Christensen Paul E
Bought by
Paul E Christensen Revocable Trust
Purchase Details
Closed on
May 8, 2014
Sold by
Christensen Paul E and Christensen Vera
Bought by
Christensen Paul E
Purchase Details
Closed on
May 28, 1996
Sold by
Benchmark Real Estate Company
Bought by
Christensen Paul E and Christensen Vera
Home Financials for this Owner
Home Financials are based on the most recent Mortgage that was taken out on this home.
Original Mortgage
$148,300
Interest Rate
7.97%
Create a Home Valuation Report for This Property
The Home Valuation Report is an in-depth analysis detailing your home's value as well as a comparison with similar homes in the area
Home Values in the Area
Average Home Value in this Area
Purchase History
| Date | Buyer | Sale Price | Title Company |
|---|---|---|---|
| Christensen Paul E | -- | Cottonwood Title | |
| Christensen Paul E | -- | Cottonwood Title | |
| Paul E Christensen Revocable Trust | -- | None Available | |
| Christensen Paul E | -- | None Available | |
| Christensen Paul E | -- | Founders Title Co |
Source: Public Records
Mortgage History
| Date | Status | Borrower | Loan Amount |
|---|---|---|---|
| Open | Christensen Paul E | $132,235 | |
| Closed | Christensen Paul E | $148,300 |
Source: Public Records
Tax History Compared to Growth
Tax History
| Year | Tax Paid | Tax Assessment Tax Assessment Total Assessment is a certain percentage of the fair market value that is determined by local assessors to be the total taxable value of land and additions on the property. | Land | Improvement |
|---|---|---|---|---|
| 2025 | $3,130 | $301,950 | $134,714 | $167,236 |
| 2024 | $2,990 | $290,400 | $121,465 | $168,935 |
| 2023 | $2,831 | $501,000 | $168,647 | $332,353 |
| 2022 | $2,834 | $275,000 | $95,655 | $179,345 |
| 2021 | $2,523 | $379,000 | $142,532 | $236,468 |
| 2020 | $2,276 | $331,000 | $119,056 | $211,944 |
| 2019 | $2,208 | $317,000 | $122,646 | $194,354 |
| 2018 | $2,035 | $290,000 | $115,039 | $174,961 |
| 2016 | $1,969 | $147,125 | $43,925 | $103,200 |
| 2015 | $1,996 | $142,065 | $43,925 | $98,140 |
| 2014 | $1,938 | $140,554 | $43,925 | $96,629 |
| 2013 | -- | $139,017 | $38,108 | $100,909 |
Source: Public Records
Map
Nearby Homes
- 1641 S 2350 W Unit B
- 4344 W 1825 S Unit 102
- 4354 W 1825 S Unit 104
- 4348 W 1825 S Unit 103
- 2679 W Antelope Dr
- 2117 W 1275 S
- 2655 S 2430 W Unit 120
- 2665 S 2430 W Unit 118
- 2655 S 2430 W Unit 116
- 2633 S 2430 W Unit 113
- 2614 S 2430 W Unit 106
- 2663 S 2430 W
- 1918 S 2465 W
- 1932 S 2150 W
- 2840 W 1200 S
- 2297 W 2175 S
- 1466 Earl Cir
- 2982 S 3000 W
- 2912 S 3000 W
- 2136 W 2200 S
- 2437 W 1500 S
- 2401 W 1500 S
- 2383 W 1500 S
- 2453 W 1500 S
- 2416 W 1500 S
- 2434 W 1500 S
- 2344 W 1580 S Unit 15
- 2344 W 1580 S Unit 17
- 2344 W 1580 S Unit 16
- 2344 W 1580 S Unit B
- 2344 W 1580 S Unit C
- 2398 W 1500 S
- 2363 W 1580 S Unit 27
- 2363 W 1580 S Unit E
- 2365 W 1500 S
- 2469 W 1500 S
- 2364 W 1580 S Unit C-20
- 2364 W 1580 S Unit A
- 1641 S 2350 W Unit 2
- 1641 S 2350 W Unit 3B