


$1,500,000
- Land
- 15.39 Acres
- $97,466 per Acre
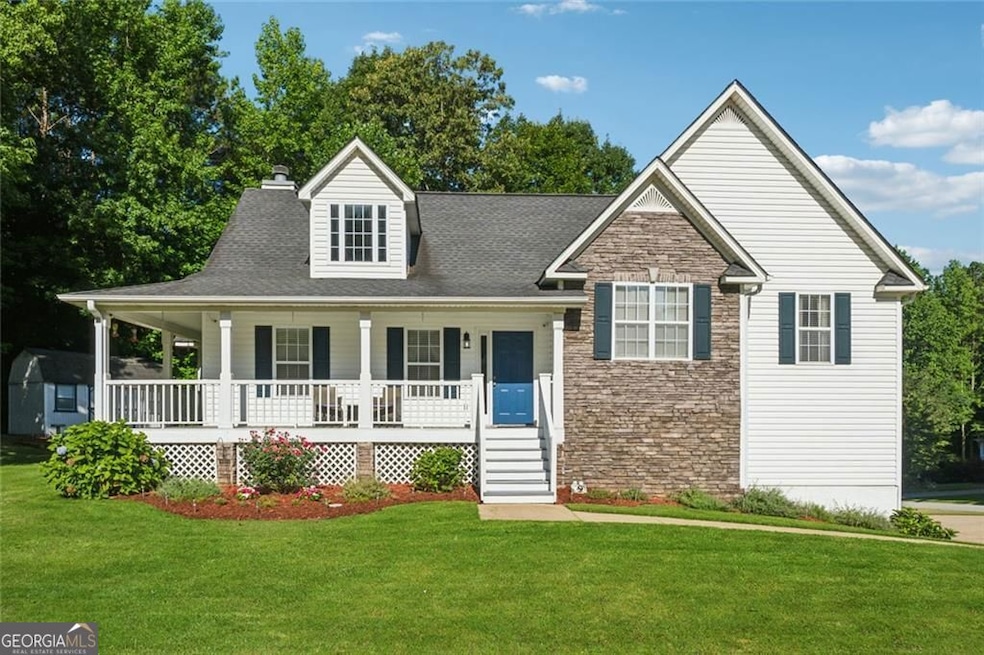
- 3089 MacLand Rd
- Dallas, GA
This 15.39 acre property is a prime development opportunity with 232' of frontage on the newly 4-laned Macland Road less than 1/2 mile from Hwy 92 and 1 mile from Hwy 120 near Costco! The front portion of the property would be ideal for retail development, taking advantage of great visibility and a high-traffic 4-land road. AADT (Annual Average Daily Traffic) is 21,000. The rear portion of the
Joe Weathers Relate Realty