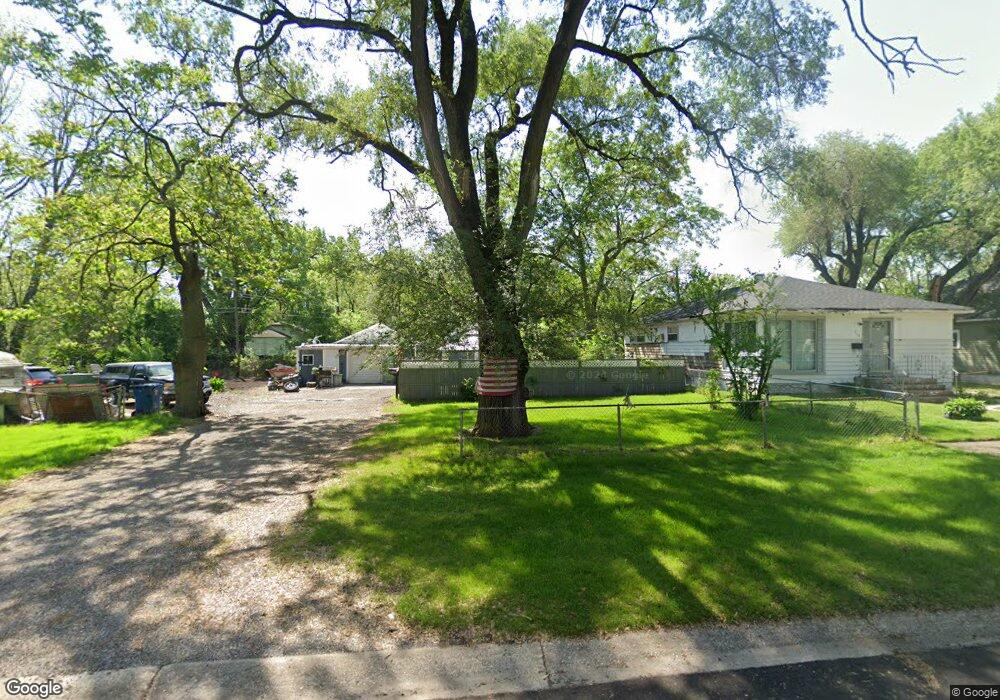
242 Calhoun St Gary, IN 46406
Brunswick NeighborhoodEstimated Value: $93,391 - $161,000
3
Beds
2
Baths
1,704
Sq Ft
$74/Sq Ft
Est. Value
About This Home
This home is located at 242 Calhoun St, Gary, IN 46406 and is currently estimated at $125,348, approximately $73 per square foot. 242 Calhoun St is a home located in Lake County with nearby schools including Bailly Preparatory Academy, West Side Leadership Academy, and Gary Lighthouse Charter School.
Ownership History
Date
Name
Owned For
Owner Type
Purchase Details
Closed on
Aug 20, 2024
Sold by
Itczak Frank J and Wescott Lynn A
Bought by
Itczak Frank J
Current Estimated Value
Purchase Details
Closed on
Feb 19, 2017
Sold by
Wscott Lynn A
Bought by
Itczak Frank J and Wescott Lynn A
Purchase Details
Closed on
Sep 2, 2014
Sold by
Itczak Farnk J
Bought by
Wescott Lynn A
Purchase Details
Closed on
Jun 10, 2012
Sold by
Sexton Fran
Bought by
Itczak Frank J
Purchase Details
Closed on
Jun 9, 2012
Sold by
Kresno Maryann
Bought by
Itczak Frank J
Purchase Details
Closed on
Jun 8, 2012
Sold by
Itczak Kevin
Bought by
Itczak Frank J
Purchase Details
Closed on
Jun 7, 2012
Sold by
Stepniewski Shirley
Bought by
Itczak Frank J
Purchase Details
Closed on
Jun 8, 2011
Sold by
Holland Elizabeth A
Bought by
Itczak Frank J
Purchase Details
Closed on
Mar 10, 2009
Sold by
Itczak Frank R and Itczak Helen
Bought by
Itczak Helen and Holland Elizabeth A
Create a Home Valuation Report for This Property
The Home Valuation Report is an in-depth analysis detailing your home's value as well as a comparison with similar homes in the area
Home Values in the Area
Average Home Value in this Area
Purchase History
| Date | Buyer | Sale Price | Title Company |
|---|---|---|---|
| Itczak Frank J | -- | None Listed On Document | |
| Itczak Frank J | -- | None Available | |
| Wescott Lynn A | -- | None Available | |
| Itczak Frank J | -- | None Available | |
| Itczak Frank J | -- | None Available | |
| Itczak Frank J | -- | None Available | |
| Itczak Frank J | -- | None Available | |
| Itczak Frank J | -- | None Available | |
| Itczak Frank J | -- | None Available | |
| Itczak Helen | -- | None Available |
Source: Public Records
Tax History Compared to Growth
Tax History
| Year | Tax Paid | Tax Assessment Tax Assessment Total Assessment is a certain percentage of the fair market value that is determined by local assessors to be the total taxable value of land and additions on the property. | Land | Improvement |
|---|---|---|---|---|
| 2024 | $6,172 | $74,200 | $9,900 | $64,300 |
| 2023 | $1,095 | $70,000 | $9,900 | $60,100 |
| 2022 | $1,095 | $63,700 | $5,700 | $58,000 |
| 2021 | $1,010 | $58,800 | $5,700 | $53,100 |
| 2020 | $1,010 | $60,100 | $5,700 | $54,400 |
| 2019 | $556 | $47,200 | $5,700 | $41,500 |
| 2018 | $591 | $48,800 | $5,700 | $43,100 |
| 2017 | $601 | $49,300 | $5,700 | $43,600 |
| 2016 | $1,170 | $51,400 | $5,700 | $45,700 |
| 2014 | $603 | $51,900 | $7,000 | $44,900 |
| 2013 | $569 | $50,200 | $7,000 | $43,200 |
Source: Public Records
Map
Nearby Homes