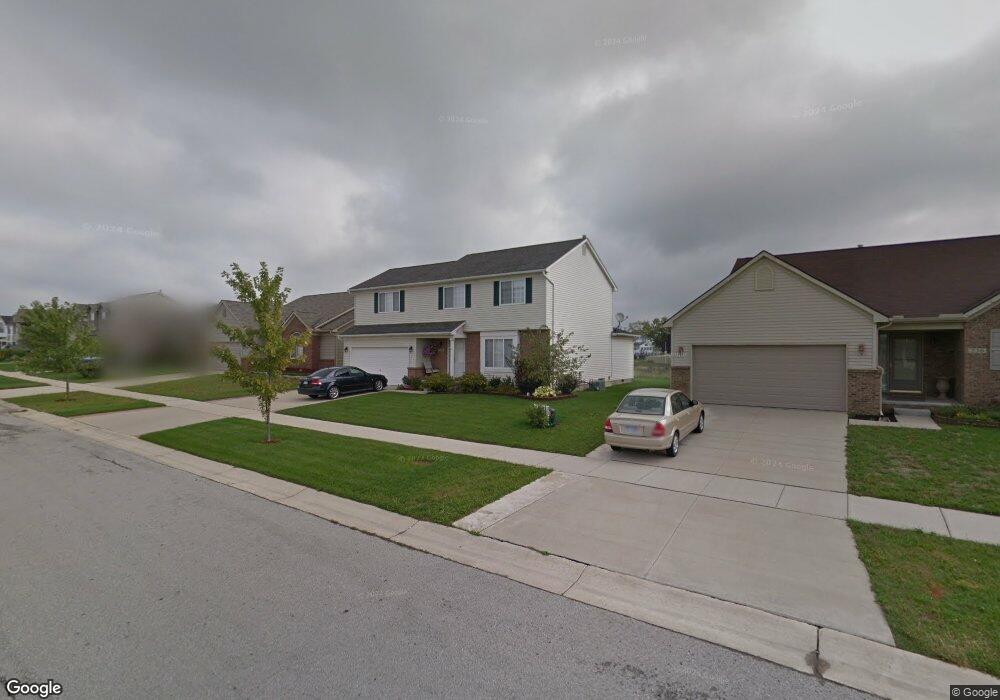
242 Caribou Run Dundee, MI 48131
Estimated Value: $320,000 - $439,000
4
Beds
3
Baths
1,850
Sq Ft
$196/Sq Ft
Est. Value
About This Home
This home is located at 242 Caribou Run, Dundee, MI 48131 and is currently estimated at $361,941, approximately $195 per square foot. 242 Caribou Run is a home located in Monroe County with nearby schools including Dundee Middle School, Dundee Elementary School, and Dundee Community High School.
Ownership History
Date
Name
Owned For
Owner Type
Purchase Details
Closed on
Oct 27, 2015
Sold by
Matzinger Erin M and Layman Erin M
Bought by
Layman Erin M and Layman Jeremy M
Current Estimated Value
Home Financials for this Owner
Home Financials are based on the most recent Mortgage that was taken out on this home.
Original Mortgage
$132,000
Outstanding Balance
$93,942
Interest Rate
3.82%
Mortgage Type
New Conventional
Estimated Equity
$267,999
Purchase Details
Closed on
Oct 8, 2009
Sold by
Rhodes David P and Cozza Rhodes Theresa K
Bought by
Primary Closing Corporation
Home Financials for this Owner
Home Financials are based on the most recent Mortgage that was taken out on this home.
Original Mortgage
$142,856
Interest Rate
5.03%
Mortgage Type
New Conventional
Purchase Details
Closed on
Aug 17, 2009
Sold by
Primary Closing Corporation
Bought by
Matzinger Erin M
Home Financials for this Owner
Home Financials are based on the most recent Mortgage that was taken out on this home.
Original Mortgage
$142,856
Interest Rate
5.03%
Mortgage Type
New Conventional
Create a Home Valuation Report for This Property
The Home Valuation Report is an in-depth analysis detailing your home's value as well as a comparison with similar homes in the area
Home Values in the Area
Average Home Value in this Area
Purchase History
| Date | Buyer | Sale Price | Title Company |
|---|---|---|---|
| Layman Erin M | -- | Hbi Title Services Inc | |
| Primary Closing Corporation | $195,500 | -- | |
| Matzinger Erin M | $155,000 | -- |
Source: Public Records
Mortgage History
| Date | Status | Borrower | Loan Amount |
|---|---|---|---|
| Open | Layman Erin M | $132,000 | |
| Previous Owner | Primary Closing Corporation | $142,856 | |
| Previous Owner | Matzinger Erin M | $142,856 |
Source: Public Records
Tax History Compared to Growth
Tax History
| Year | Tax Paid | Tax Assessment Tax Assessment Total Assessment is a certain percentage of the fair market value that is determined by local assessors to be the total taxable value of land and additions on the property. | Land | Improvement |
|---|---|---|---|---|
| 2025 | $2,436 | $154,300 | $154,300 | $0 |
| 2024 | $1,848 | $142,940 | $0 | $0 |
| 2023 | $899 | $121,070 | $0 | $0 |
| 2022 | $1,558 | $121,070 | $0 | $0 |
| 2021 | $2,842 | $98,950 | $0 | $0 |
| 2020 | $2,801 | $93,900 | $0 | $0 |
| 2019 | $1,460 | $93,900 | $0 | $0 |
| 2018 | $2,691 | $97,480 | $0 | $0 |
| 2017 | $2,571 | $97,480 | $0 | $0 |
| 2016 | $1,889 | $92,260 | $0 | $0 |
| 2015 | $1,877 | $82,250 | $0 | $0 |
| 2014 | $2,501 | $82,250 | $0 | $0 |
| 2013 | $1,772 | $81,850 | $0 | $0 |
Source: Public Records
Map
Nearby Homes
- 671 Elk Ridge Dr
- 656 Elk Ridge Dr
- 289 White Owl Ln Unit 234
- 295 White Owl Ln Unit 235
- 644 Elk Ridge Dr
- 769 Falcon Dr
- 495 Mcbride St
- 510 Main St
- 13952 Stowell Rd
- 439 E Monroe St
- 5080 Wilshire Dr Unit 53
- 190 Sidney St
- 5089 Wilshire Dr
- 703 Chase Hanna St Unit 1
- 755 Henning St Unit 28
- 785 Chase Hanna St Unit 6
- 835 Henning St
- 2 Covell
- 7 Covell Rd
- 4 Covell Rd
- 248 Caribou Run
- 236 Caribou Run
- 245 Caribou Run
- 239 Caribou Run
- 251 Caribou Run
- 233 Caribou Run
- 254 Caribou Run
- 230 Caribou Run
- 227 Caribou Run
- 257 Caribou Run
- 263 Caribou Run
- 224 Caribou Run
- 221 Caribou Run
- 266 Caribou Run
- 218 Caribou Run
- 275 Caribou Run
- 250 Dundee Ridge Dr
- 244 Dundee Ridge Dr
- 256 Dundee Ridge Dr
- 269 Caribou Run