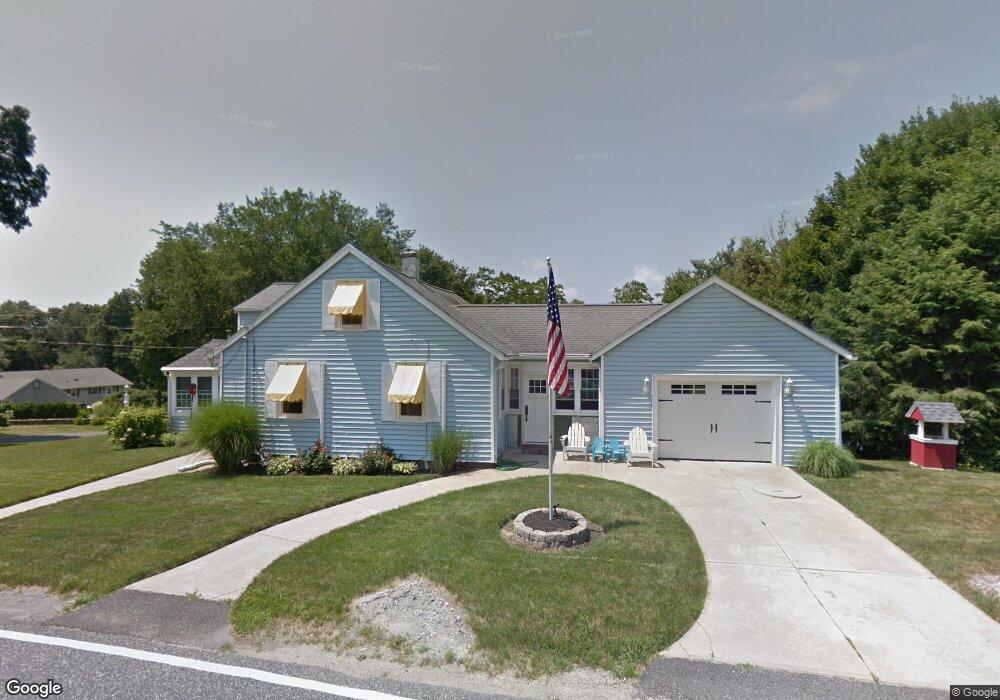
242 Chestnut St Rehoboth, MA 02769
Estimated Value: $523,196 - $682,000
3
Beds
1
Bath
1,703
Sq Ft
$349/Sq Ft
Est. Value
About This Home
This home is located at 242 Chestnut St, Rehoboth, MA 02769 and is currently estimated at $593,549, approximately $348 per square foot. 242 Chestnut St is a home located in Bristol County with nearby schools including Dighton-Rehoboth Regional High School and Cedar Brook School.
Ownership History
Date
Name
Owned For
Owner Type
Purchase Details
Closed on
Nov 21, 2024
Sold by
Martin Denise R
Bought by
Stearns
Current Estimated Value
Purchase Details
Closed on
Aug 1, 1973
Bought by
Tremblay Joseph L and Tremblay Denise
Create a Home Valuation Report for This Property
The Home Valuation Report is an in-depth analysis detailing your home's value as well as a comparison with similar homes in the area
Home Values in the Area
Average Home Value in this Area
Purchase History
| Date | Buyer | Sale Price | Title Company |
|---|---|---|---|
| Stearns | -- | None Available | |
| Stearns | -- | None Available | |
| Tremblay Joseph L | -- | -- |
Source: Public Records
Mortgage History
| Date | Status | Borrower | Loan Amount |
|---|---|---|---|
| Previous Owner | Tremblay Joseph L | $58,000 | |
| Previous Owner | Tremblay Joseph L | $47,500 | |
| Previous Owner | Tremblay Joseph L | $35,000 | |
| Previous Owner | Tremblay Joseph L | $15,000 |
Source: Public Records
Tax History Compared to Growth
Tax History
| Year | Tax Paid | Tax Assessment Tax Assessment Total Assessment is a certain percentage of the fair market value that is determined by local assessors to be the total taxable value of land and additions on the property. | Land | Improvement |
|---|---|---|---|---|
| 2025 | $48 | $433,600 | $190,400 | $243,200 |
| 2024 | $4,622 | $406,900 | $190,400 | $216,500 |
| 2023 | $4,542 | $392,200 | $186,400 | $205,800 |
| 2022 | $4,008 | $316,300 | $178,000 | $138,300 |
| 2021 | $0 | $295,400 | $161,700 | $133,700 |
| 2020 | $3,695 | $281,600 | $161,700 | $119,900 |
| 2018 | $3,674 | $272,800 | $153,900 | $118,900 |
| 2017 | $3,426 | $272,800 | $153,900 | $118,900 |
| 2016 | $3,315 | $272,800 | $153,900 | $118,900 |
| 2015 | $3,276 | $266,100 | $146,700 | $119,400 |
| 2014 | $3,117 | $250,600 | $139,500 | $111,100 |
Source: Public Records
Map
Nearby Homes
- 267 Chestnut St
- 42 Linden Ln
- 198 Brook St
- 8 Linden Ln
- 8 Linden Ln
- 120 Plain St
- 92 Martin St
- 14 Deborah Ann Dr Unit 41
- 36 Columbine Rd
- 75 Martin St
- 39 Peckham St
- 0 Winter St
- 32 Providence St
- 129 Cameron Way
- 3a Johnnies Way
- 3b Johnnies Way
- 3 Johnnies Way
- 20 School St
- 7 Johnnies Way
- 203 Providence St Bldr Lot 5
- 243 Chestnut St
- 246 Chestnut St
- 238 Chestnut St
- 117 Brook St
- 247 Chestnut St
- 236 Chestnut St
- 122 Brook St
- 107 Brook St
- 249 Chestnut St
- 104 Brook St
- 248 Chestnut St Unit 252
- 232 Chestnut St
- 101 Brook St Unit 103
- Lot 49 Brook St
- 255 Chestnut St
- 253 Chestnut St
- 253 Chestnut St Unit RIGHT
- 253 Chestnut St Unit LEFT
- 253 Chestnut St
- 126 Brook St