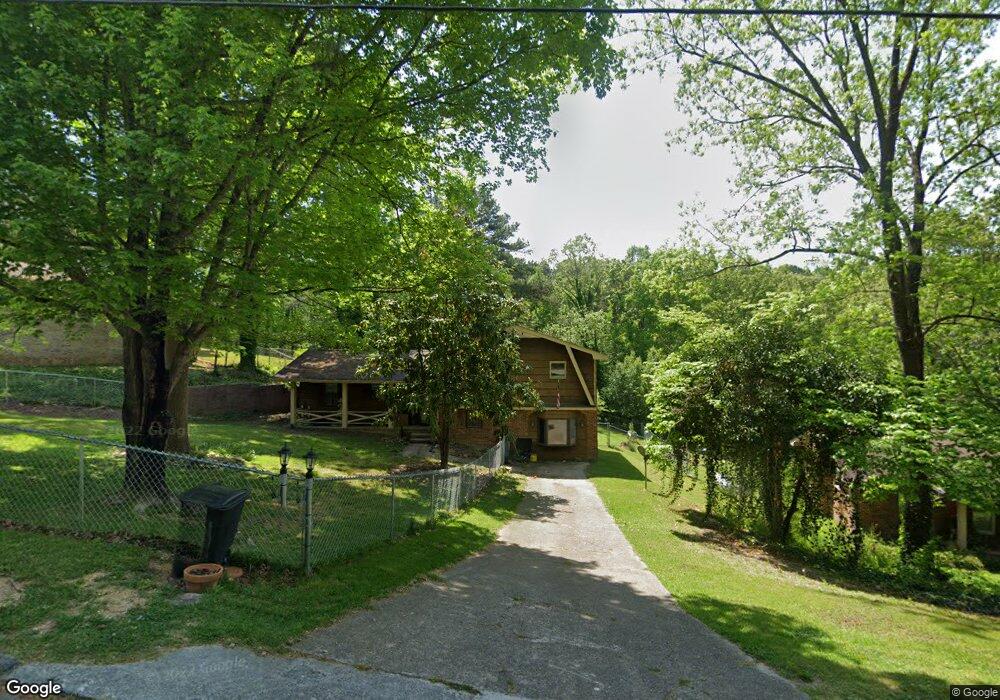
242 Cinderella Dr Flintstone, GA 30725
Flintstone NeighborhoodEstimated Value: $231,667 - $283,000
3
Beds
2
Baths
1,866
Sq Ft
$133/Sq Ft
Est. Value
About This Home
This home is located at 242 Cinderella Dr, Flintstone, GA 30725 and is currently estimated at $248,417, approximately $133 per square foot. 242 Cinderella Dr is a home located in Walker County with nearby schools including Chattanooga Valley Elementary School, Chattanooga Valley Middle School, and Ridgeland High School.
Ownership History
Date
Name
Owned For
Owner Type
Purchase Details
Closed on
Dec 21, 2007
Sold by
Perry Reba J
Bought by
Wilson Timothy J and Wilson Sara E
Current Estimated Value
Home Financials for this Owner
Home Financials are based on the most recent Mortgage that was taken out on this home.
Original Mortgage
$120,115
Outstanding Balance
$75,436
Interest Rate
6.15%
Mortgage Type
FHA
Estimated Equity
$172,981
Purchase Details
Closed on
Nov 22, 2005
Sold by
Perry Reba J
Bought by
Perry George W
Purchase Details
Closed on
Jan 10, 1985
Sold by
Brewer James E and Brewer Reba J
Bought by
Brewer Reba J
Purchase Details
Closed on
Feb 5, 1976
Sold by
Guaranty Mortgage Co Of Nash
Bought by
Brewer James E and Brewer Reba J
Purchase Details
Closed on
Aug 5, 1975
Sold by
Gentry E L
Bought by
Guaranty Mortgage Co Of Nash
Purchase Details
Closed on
Jan 1, 1972
Bought by
Gentry E L
Create a Home Valuation Report for This Property
The Home Valuation Report is an in-depth analysis detailing your home's value as well as a comparison with similar homes in the area
Home Values in the Area
Average Home Value in this Area
Purchase History
| Date | Buyer | Sale Price | Title Company |
|---|---|---|---|
| Wilson Timothy J | $122,000 | -- | |
| Perry George W | -- | -- | |
| Brewer Reba J | -- | -- | |
| Brewer James E | -- | -- | |
| Guaranty Mortgage Co Of Nash | -- | -- | |
| Gentry E L | -- | -- |
Source: Public Records
Mortgage History
| Date | Status | Borrower | Loan Amount |
|---|---|---|---|
| Open | Wilson Timothy J | $120,115 |
Source: Public Records
Tax History Compared to Growth
Tax History
| Year | Tax Paid | Tax Assessment Tax Assessment Total Assessment is a certain percentage of the fair market value that is determined by local assessors to be the total taxable value of land and additions on the property. | Land | Improvement |
|---|---|---|---|---|
| 2024 | $1,619 | $73,614 | $7,545 | $66,069 |
| 2023 | $1,573 | $69,971 | $7,545 | $62,426 |
| 2022 | $1,356 | $55,305 | $4,231 | $51,074 |
| 2021 | $1,045 | $38,065 | $4,231 | $33,834 |
| 2020 | $928 | $32,335 | $4,231 | $28,104 |
| 2019 | $943 | $32,335 | $4,231 | $28,104 |
| 2018 | $856 | $32,335 | $4,231 | $28,104 |
| 2017 | $803 | $32,335 | $4,231 | $28,104 |
| 2016 | $872 | $32,335 | $4,231 | $28,104 |
| 2015 | $959 | $33,834 | $4,216 | $29,618 |
| 2014 | $868 | $33,834 | $4,216 | $29,618 |
| 2013 | -- | $33,834 | $4,216 | $29,618 |
Source: Public Records
Map
Nearby Homes
- 209 Cinderella Dr
- 569 Tinker Bell Cir
- 588 Tinker Bell Cir
- 4302 Happy Valley Rd
- 4200 Happy Valley Rd
- 76 Saddlebred Way
- 4766 Happy Valley Rd
- 132 Saddlebred Way
- 163 Saddlebred Way
- 115 Saddlebred Way
- 114 Saddlebred Way
- 100 Saddlebred Way
- 18 Buck Creek Ln
- 278 Dry Valley Rd
- 306 Dry Valley Rd
- 2937 Happy Valley Rd
- 22 Ridgeland Cir
- 12 Fox Run Cir S
- 220 Cinderella Dr
- 231 Cinderella Dr
- 200 Cinderella Dr
- 249 Cinderella Dr
- 27 Glass Slipper Trail
- 187 Cinderella Dr
- 184 Cinderella Dr
- 557 Tinker Bell Cir
- 26 Glass Slipper Trail
- 0 Cinderella Dr
- 167 Cinderella Dr
- 70 Fox Run Cir S
- 170 Cinderella Dr
- 49 Glass Slipper Trail
- 527 Tinker Bell Cir
- 50 Glass Slipper Trail
- 71 Fox Run Cir S
- 145 Cinderella Dr
- 137 Fox Run Cir S