Estimated Value: $276,000 - $344,000
3
Beds
3
Baths
2,189
Sq Ft
$138/Sq Ft
Est. Value
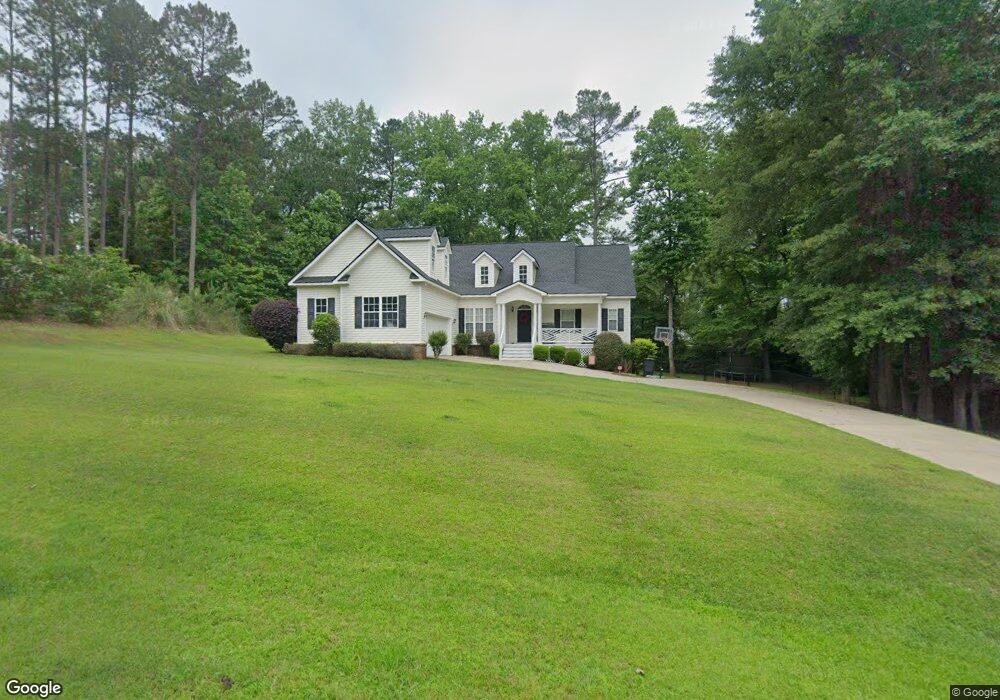
About This Home
This home is located at 242 Crestview Trace Unit 7, Gray, GA 31032 and is currently estimated at $301,854, approximately $137 per square foot. 242 Crestview Trace Unit 7 is a home located in Jones County with nearby schools including Dames Ferry Elementary School, Gray Station Middle School, and Jones County High School.
Ownership History
Date
Name
Owned For
Owner Type
Purchase Details
Closed on
Oct 10, 2013
Sold by
Fruge Richard W
Bought by
Melvin Timothy C and Melvin Bethany H
Current Estimated Value
Home Financials for this Owner
Home Financials are based on the most recent Mortgage that was taken out on this home.
Original Mortgage
$155,200
Outstanding Balance
$115,891
Interest Rate
4.57%
Mortgage Type
New Conventional
Estimated Equity
$185,963
Purchase Details
Closed on
Apr 25, 2005
Sold by
Wayne Bullington Construct
Bought by
Fruge Richard W and Fruge Janet M
Home Financials for this Owner
Home Financials are based on the most recent Mortgage that was taken out on this home.
Original Mortgage
$120,000
Interest Rate
5.99%
Mortgage Type
New Conventional
Purchase Details
Closed on
Aug 24, 2001
Sold by
M & H Designs
Bought by
Wayne Bullington Construction
Create a Home Valuation Report for This Property
The Home Valuation Report is an in-depth analysis detailing your home's value as well as a comparison with similar homes in the area
Home Values in the Area
Average Home Value in this Area
Purchase History
| Date | Buyer | Sale Price | Title Company |
|---|---|---|---|
| Melvin Timothy C | $160,000 | -- | |
| Fruge Richard W | $190,000 | -- | |
| Wayne Bullington Construction | $281,000 | -- |
Source: Public Records
Mortgage History
| Date | Status | Borrower | Loan Amount |
|---|---|---|---|
| Open | Melvin Timothy C | $155,200 | |
| Previous Owner | Fruge Richard W | $120,000 |
Source: Public Records
Tax History
| Year | Tax Paid | Tax Assessment Tax Assessment Total Assessment is a certain percentage of the fair market value that is determined by local assessors to be the total taxable value of land and additions on the property. | Land | Improvement |
|---|---|---|---|---|
| 2025 | $3,295 | $104,154 | $11,960 | $92,194 |
| 2023 | $2,607 | $73,404 | $9,200 | $64,204 |
| 2022 | $2,500 | $69,587 | $9,200 | $60,387 |
| 2021 | $2,502 | $69,587 | $9,200 | $60,387 |
| 2020 | $2,504 | $69,587 | $9,200 | $60,387 |
| 2019 | $2,436 | $67,704 | $9,200 | $58,504 |
| 2018 | $2,436 | $67,704 | $9,200 | $58,504 |
| 2017 | $2,436 | $67,704 | $9,200 | $58,504 |
| 2016 | $2,436 | $67,704 | $9,200 | $58,504 |
| 2015 | $2,299 | $67,554 | $9,200 | $58,354 |
| 2014 | $2,005 | $67,554 | $9,200 | $58,354 |
Source: Public Records
Map
Nearby Homes
- 337 Georgia 18
- 1134 Porter Cir
- 1129 Porter Cir
- 320 Amanda Dr
- 3331 Trotters Ridge Trail
- 354 Pineview Rd
- 128 Clinton Crossing Dr
- 191 Henry Dr
- 0 Clinton Crossing Dr Unit M181966
- 0 Braswell Lake Rd
- 173 Henry Dr
- 266 Clinton Crossing Dr
- 146 Lite N Tie Rd
- 0 Clinton Crossing Unit 10637924
- 140 Lite-N-tie Rd
- 229 Lite N Tie Rd
- 354 Lite N Tie Rd
- 250 Stone Brooke Dr Unit LOT 133
- 250 Stone Brooke Dr
- 250 Stone Brooke Lot 133 Dr
- 242 Crestview Trace
- 248 Crestview Trace
- 234 Crestview Trace
- 143 Hunting Dr
- 229 Crestview Trace
- 249 Crestview Trace
- 230 Crestview Trace
- 243 Crestview Trace
- 149 Hunting Dr
- 263 Crestview Trace
- 263 Crestview Trace Unit 35
- 219 Crestview Trace
- 256 Crestview Trace
- 155 Hunting Dr
- 269 Crestview Trace
- 220 Crestview Trace
- 260 Crestview Trace
- 139 Hunting Dr
- 409 Crestview Ln
- 215 Crestview Trace
Your Personal Tour Guide
Ask me questions while you tour the home.