Estimated Value: $213,000 - $277,000
3
Beds
1
Bath
1,404
Sq Ft
$180/Sq Ft
Est. Value
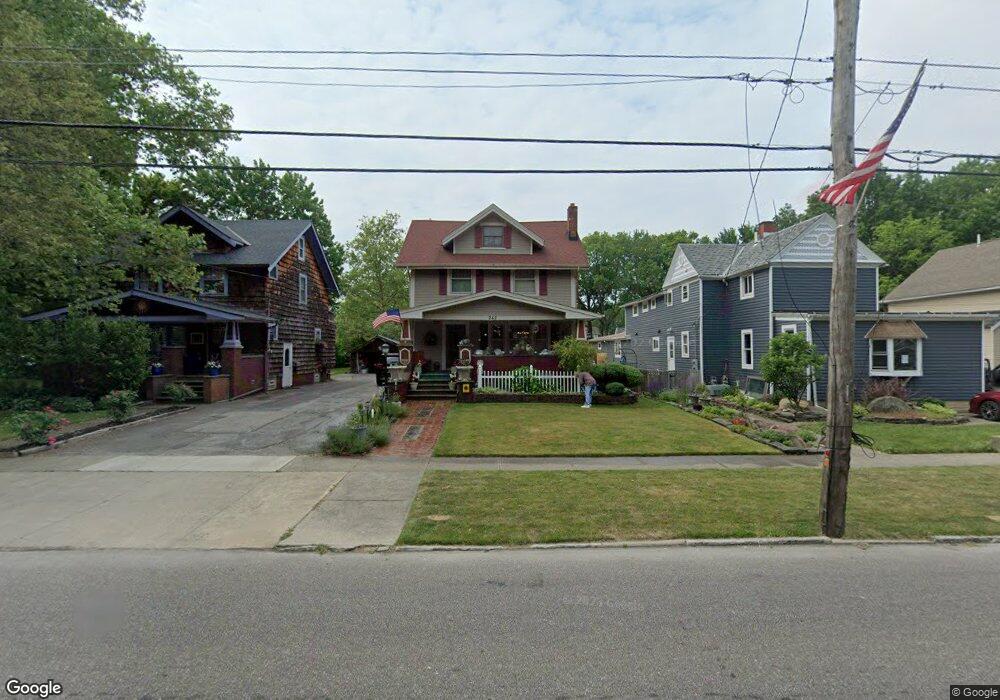
About This Home
This home is located at 242 E Bridge St, Berea, OH 44017 and is currently estimated at $252,389, approximately $179 per square foot. 242 E Bridge St is a home located in Cuyahoga County with nearby schools including Grindstone Elementary School, Berea-Midpark Middle School, and Berea-Midpark High School.
Ownership History
Date
Name
Owned For
Owner Type
Purchase Details
Closed on
May 26, 2000
Sold by
Zacharyasz Craig E and Zacharyasz Christine
Bought by
Zdravecky John P and Zdravecky Nina A
Current Estimated Value
Home Financials for this Owner
Home Financials are based on the most recent Mortgage that was taken out on this home.
Original Mortgage
$175,655
Outstanding Balance
$56,109
Interest Rate
8.13%
Estimated Equity
$196,280
Purchase Details
Closed on
Jul 21, 1982
Bought by
Zacharyasz Craig E
Purchase Details
Closed on
Mar 16, 1982
Sold by
Cucuzza Carl
Bought by
Ohio Sav Assoc
Purchase Details
Closed on
Aug 5, 1977
Sold by
Majcher Walter J and Majcher Lois J
Bought by
Cucuzza Carl
Purchase Details
Closed on
Jan 1, 1975
Bought by
Majcher Walter J and Majcher Lois J
Create a Home Valuation Report for This Property
The Home Valuation Report is an in-depth analysis detailing your home's value as well as a comparison with similar homes in the area
Home Values in the Area
Average Home Value in this Area
Purchase History
| Date | Buyer | Sale Price | Title Company |
|---|---|---|---|
| Zdravecky John P | $184,900 | Midland Title Security Inc | |
| Zacharyasz Craig E | $34,000 | -- | |
| Ohio Sav Assoc | $26,000 | -- | |
| Cucuzza Carl | $36,900 | -- | |
| Majcher Walter J | -- | -- |
Source: Public Records
Mortgage History
| Date | Status | Borrower | Loan Amount |
|---|---|---|---|
| Open | Zdravecky John P | $175,655 |
Source: Public Records
Tax History
| Year | Tax Paid | Tax Assessment Tax Assessment Total Assessment is a certain percentage of the fair market value that is determined by local assessors to be the total taxable value of land and additions on the property. | Land | Improvement |
|---|---|---|---|---|
| 2025 | $4,422 | $76,335 | $12,040 | $64,295 |
| 2024 | $4,415 | $76,335 | $12,040 | $64,295 |
| 2023 | $3,906 | $56,560 | $11,060 | $45,500 |
| 2022 | $3,882 | $56,560 | $11,060 | $45,500 |
| 2021 | $3,849 | $56,560 | $11,060 | $45,500 |
| 2020 | $3,678 | $47,950 | $9,380 | $38,570 |
| 2019 | $3,580 | $137,000 | $26,800 | $110,200 |
| 2018 | $3,994 | $47,950 | $9,380 | $38,570 |
| 2017 | $4,725 | $59,050 | $8,790 | $50,260 |
| 2016 | $4,690 | $59,050 | $8,790 | $50,260 |
| 2015 | $4,615 | $59,050 | $8,790 | $50,260 |
| 2014 | $4,615 | $61,500 | $9,140 | $52,360 |
Source: Public Records
Map
Nearby Homes
- 0 E Bagley Rd Unit 5111166
- 57 Riverside Dr
- 49 Monroe St
- 7640 S Eastland Rd
- 275 Quarrystone Ln
- 584 Eastland Rd
- 56 3rd Ave
- 143 Baker St
- 7400 Engle Rd
- 333 Parkway Dr
- 160 Marian Ln Unit 6A
- 169 Kempton Dr
- 146 Marian Ln
- 7256 Markal Dr
- 659 Wesley Dr
- 53 Greenfield Ct
- 380 Adrian Dr
- 16879 Brinbourne Ave
- 347 Beeler Dr
- 8036 Fair Rd
- 238 E Bridge St
- 246 E Bridge St
- 232 E Bridge St
- 256 E Bridge St
- 228 E Bridge St
- 241 E Bridge St
- 251 E Bridge St
- 235 E Bridge St
- 260 E Bridge St
- 224 E Bridge St
- 227 E Bridge St
- 220 E Bridge St
- 253 E Bridge St
- 263 E Bridge St
- 223 E Bridge St
- 161 Eastland Rd
- 216 E Bridge St
- 209 Eastland Rd
- 212 E Bridge St
- 217 E Bridge St
Your Personal Tour Guide
Ask me questions while you tour the home.