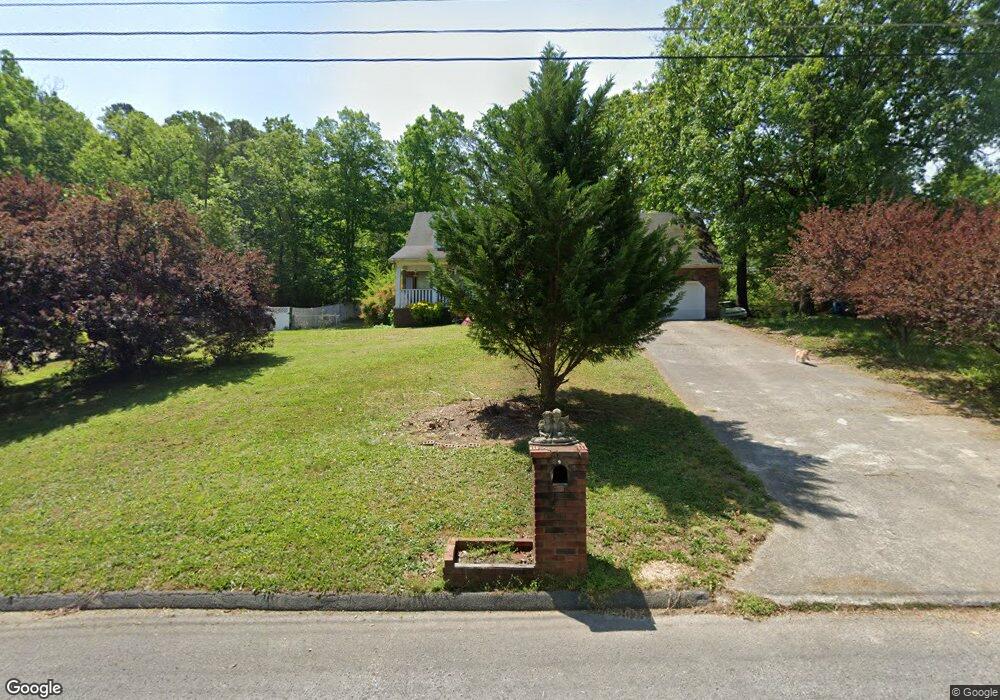
242 Fox Run Cir S Flintstone, GA 30725
Flintstone NeighborhoodEstimated Value: $206,911 - $302,000
--
Bed
2
Baths
1,660
Sq Ft
$164/Sq Ft
Est. Value
About This Home
This home is located at 242 Fox Run Cir S, Flintstone, GA 30725 and is currently estimated at $272,478, approximately $164 per square foot. 242 Fox Run Cir S is a home located in Walker County with nearby schools including Chattanooga Valley Elementary School, Chattanooga Valley Middle School, and Ridgeland High School.
Ownership History
Date
Name
Owned For
Owner Type
Purchase Details
Closed on
May 7, 2008
Sold by
Reynolds Thomas W
Bought by
Reynolds Thomas W and Reynolds Jett Charlene
Current Estimated Value
Home Financials for this Owner
Home Financials are based on the most recent Mortgage that was taken out on this home.
Original Mortgage
$232,500
Outstanding Balance
$127,450
Interest Rate
3.43%
Mortgage Type
New Conventional
Estimated Equity
$145,028
Purchase Details
Closed on
Sep 19, 1988
Sold by
Botts Danny and Botts Elisabeth
Bought by
Reynolds Thomas W and Reynolds Charlene
Purchase Details
Closed on
Mar 31, 1987
Sold by
Commerce Union Bank
Bought by
Botts Danny and Botts Elisabeth
Purchase Details
Closed on
Aug 29, 1986
Sold by
Massey Lebron and Stan Guthrie
Bought by
Commerce Union Bank
Purchase Details
Closed on
Dec 22, 1980
Bought by
Massey Lebron and Stan Guthrie
Create a Home Valuation Report for This Property
The Home Valuation Report is an in-depth analysis detailing your home's value as well as a comparison with similar homes in the area
Home Values in the Area
Average Home Value in this Area
Purchase History
| Date | Buyer | Sale Price | Title Company |
|---|---|---|---|
| Reynolds Thomas W | -- | -- | |
| Reynolds Thomas W | -- | -- | |
| Botts Danny | -- | -- | |
| Commerce Union Bank | -- | -- | |
| Massey Lebron | -- | -- |
Source: Public Records
Mortgage History
| Date | Status | Borrower | Loan Amount |
|---|---|---|---|
| Open | Reynolds Thomas W | $232,500 | |
| Closed | Reynolds Thomas W | $232,500 |
Source: Public Records
Tax History Compared to Growth
Tax History
| Year | Tax Paid | Tax Assessment Tax Assessment Total Assessment is a certain percentage of the fair market value that is determined by local assessors to be the total taxable value of land and additions on the property. | Land | Improvement |
|---|---|---|---|---|
| 2024 | $526 | $79,603 | $6,600 | $73,003 |
| 2023 | $446 | $74,251 | $5,000 | $69,251 |
| 2022 | $194 | $61,682 | $5,000 | $56,682 |
| 2021 | $166 | $47,183 | $5,000 | $42,183 |
| 2020 | $166 | $41,267 | $5,000 | $36,267 |
| 2019 | $166 | $41,267 | $5,000 | $36,267 |
| 2018 | $1,092 | $41,267 | $5,000 | $36,267 |
| 2017 | $310 | $41,267 | $5,000 | $36,267 |
| 2016 | $130 | $41,267 | $5,000 | $36,267 |
| 2015 | $130 | $41,448 | $5,000 | $36,448 |
| 2014 | $65 | $41,448 | $5,000 | $36,448 |
| 2013 | -- | $41,448 | $5,000 | $36,448 |
Source: Public Records
Map
Nearby Homes
- 137 Fox Run Cir N
- 113 Fox Run Cir N
- 184 Cinderella Dr
- 569 Tinker Bell Cir
- 4302 Happy Valley Rd
- 76 Saddlebred Way
- 114 Saddlebred Way
- 18 Buck Creek Ln
- 278 Dry Valley Rd
- 306 Dry Valley Rd
- 2937 Happy Valley Rd
- 4766 Happy Valley Rd
- 297 Draft St
- 307 Draft St
- 313 Draft St
- 880 Dry Valley Rd
- 259 Draft St
- 346 Draft St
- 55 Saddlebred Way
- 105 Saddlebred Way
- 226 Fox Run Cir S
- 262 Fox Run Cir S
- 231 Fox Run Cir S
- 208 Fox Run Cir S
- 188 Fox Run Cir S
- 136 Fox Run Cir S
- 15 Fox Lair Trail
- 125 Fox Run Cir S
- 0 Fox Run Cir S
- 118 Fox Run Cir S
- 1317 Cinderella Dr
- 194 Fox Run Cir N
- 117 Fox Run Cir S
- 87 Fox Lair Trail
- 104 Fox Run Cir S
- 82 Fox Run Cir S
- 226 Fox Run Cir N
- 148 Fox Run Cir N
- 188 Fox Run Cir N
- 38 Fox Run Cir N