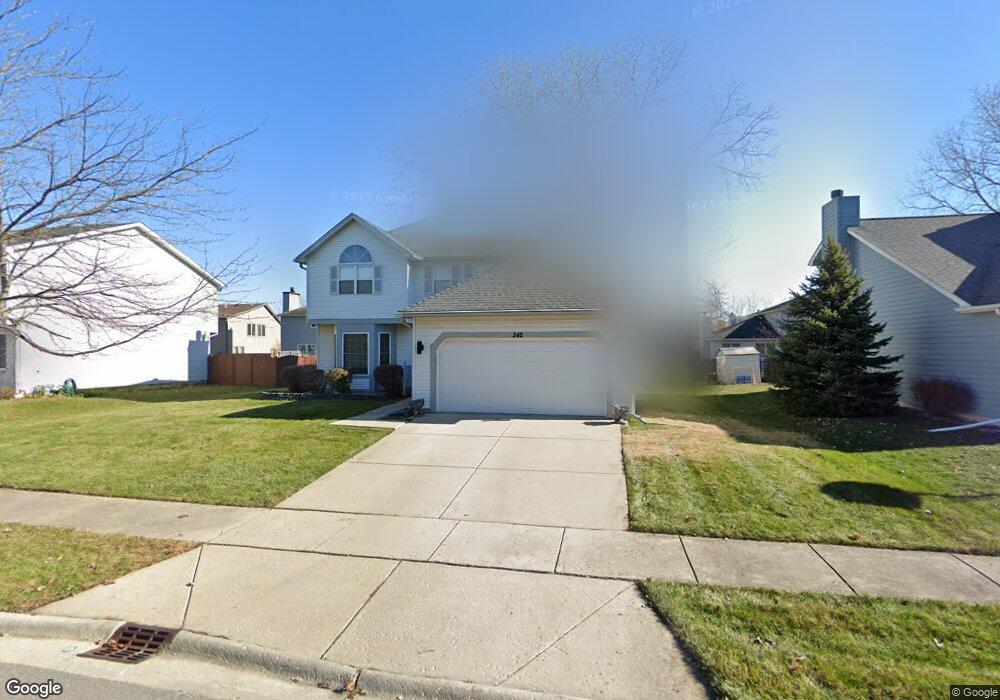
242 Laurie Cir Bolingbrook, IL 60440
East Bolingbrook NeighborhoodEstimated Value: $372,000 - $399,000
4
Beds
3
Baths
2,060
Sq Ft
$189/Sq Ft
Est. Value
About This Home
This home is located at 242 Laurie Cir, Bolingbrook, IL 60440 and is currently estimated at $389,409, approximately $189 per square foot. 242 Laurie Cir is a home located in Will County with nearby schools including John R Tibbott Elementary School, Hubert H Humphrey Middle School, and Bolingbrook High School.
Ownership History
Date
Name
Owned For
Owner Type
Purchase Details
Closed on
Oct 7, 2015
Sold by
Gordey Michelle and Esparza Carlos
Bought by
Gordey Michelle
Current Estimated Value
Home Financials for this Owner
Home Financials are based on the most recent Mortgage that was taken out on this home.
Original Mortgage
$193,200
Outstanding Balance
$153,235
Interest Rate
4.12%
Mortgage Type
New Conventional
Estimated Equity
$236,174
Purchase Details
Closed on
Dec 4, 2008
Sold by
Hazelett Kenneth L
Bought by
Gordey Michelle and Esparza Carlos
Home Financials for this Owner
Home Financials are based on the most recent Mortgage that was taken out on this home.
Original Mortgage
$210,622
Interest Rate
5.09%
Mortgage Type
FHA
Purchase Details
Closed on
Oct 13, 2000
Sold by
Scanlon Thomas A and Scanlon Janet L
Bought by
Hazelett Kenneth L and Gordey Michelle
Home Financials for this Owner
Home Financials are based on the most recent Mortgage that was taken out on this home.
Original Mortgage
$127,600
Interest Rate
7.96%
Create a Home Valuation Report for This Property
The Home Valuation Report is an in-depth analysis detailing your home's value as well as a comparison with similar homes in the area
Home Values in the Area
Average Home Value in this Area
Purchase History
| Date | Buyer | Sale Price | Title Company |
|---|---|---|---|
| Gordey Michelle | -- | Plymouth Title Guaranty Corp | |
| Gordey Michelle | -- | None Available | |
| Hazelett Kenneth L | $176,000 | -- |
Source: Public Records
Mortgage History
| Date | Status | Borrower | Loan Amount |
|---|---|---|---|
| Open | Gordey Michelle | $193,200 | |
| Previous Owner | Gordey Michelle | $210,622 | |
| Previous Owner | Hazelett Kenneth L | $127,600 |
Source: Public Records
Tax History Compared to Growth
Tax History
| Year | Tax Paid | Tax Assessment Tax Assessment Total Assessment is a certain percentage of the fair market value that is determined by local assessors to be the total taxable value of land and additions on the property. | Land | Improvement |
|---|---|---|---|---|
| 2024 | $9,900 | $115,197 | $18,896 | $96,301 |
| 2023 | $9,900 | $103,650 | $17,002 | $86,648 |
| 2022 | $8,644 | $93,446 | $15,328 | $78,118 |
| 2021 | $8,192 | $87,374 | $14,332 | $73,042 |
| 2020 | $7,940 | $84,501 | $13,861 | $70,640 |
| 2019 | $7,684 | $80,477 | $13,201 | $67,276 |
| 2018 | $7,377 | $77,026 | $12,635 | $64,391 |
| 2017 | $7,023 | $73,010 | $11,976 | $61,034 |
| 2016 | $6,819 | $69,500 | $11,400 | $58,100 |
| 2015 | $7,358 | $66,600 | $10,900 | $55,700 |
| 2014 | $7,358 | $72,300 | $11,800 | $60,500 |
| 2013 | $7,358 | $72,300 | $11,800 | $60,500 |
Source: Public Records
Map
Nearby Homes
- 564 White Oak Rd
- 520 White Oak Rd
- 144 N Pinecrest Rd
- 304 N Pinecrest Rd
- 101 Seabury Rd
- 157 Vernon Dr Unit 6
- 308 Homewood Dr
- 129 Oxford Rd Unit 5
- 220 N Ashbury Ave
- 338 Stafford Way
- 208 S Pinecrest Rd
- 325 Rockhurst Rd
- 113 Cedarwood Ave
- 451 Alcester Ct
- 316 Bedford Rd
- 168 Bedford Rd
- 308 Pacific Dr
- 219 Monterey Dr
- 255 Braemar Glen
- 220 Falcon Ridge Way