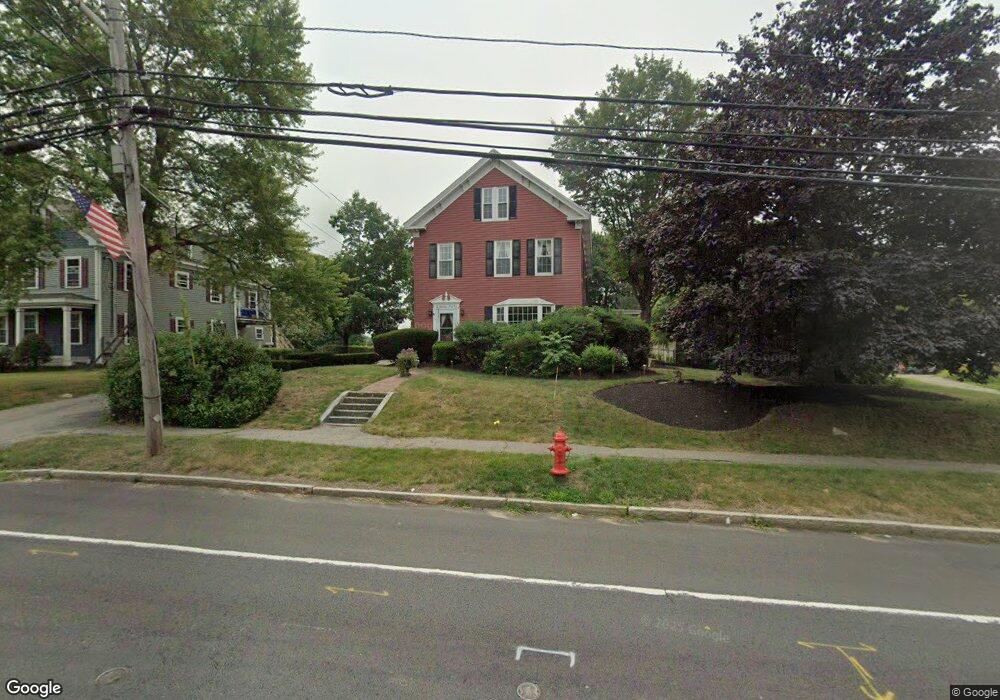
242 Main St Spencer, MA 01562
Estimated Value: $410,408 - $546,000
5
Beds
2
Baths
2,600
Sq Ft
$176/Sq Ft
Est. Value
About This Home
This home is located at 242 Main St, Spencer, MA 01562 and is currently estimated at $456,352, approximately $175 per square foot. 242 Main St is a home located in Worcester County with nearby schools including David Prouty High School.
Ownership History
Date
Name
Owned For
Owner Type
Purchase Details
Closed on
Sep 25, 2012
Sold by
Carlson 3Rd Harry J and Hair Renne
Bought by
Carlson Ronald E
Current Estimated Value
Purchase Details
Closed on
Aug 7, 1998
Sold by
Salvadore Samuel P and Salvadore Kathleen
Bought by
Rutland Town Of
Purchase Details
Closed on
Nov 13, 1989
Sold by
Oliver Chester
Bought by
Salvatore Samuel
Home Financials for this Owner
Home Financials are based on the most recent Mortgage that was taken out on this home.
Original Mortgage
$240,000
Interest Rate
10.03%
Mortgage Type
Purchase Money Mortgage
Create a Home Valuation Report for This Property
The Home Valuation Report is an in-depth analysis detailing your home's value as well as a comparison with similar homes in the area
Home Values in the Area
Average Home Value in this Area
Purchase History
| Date | Buyer | Sale Price | Title Company |
|---|---|---|---|
| Carlson Ronald E | $94,800 | -- | |
| Rutland Town Of | $238,000 | -- | |
| Salvatore Samuel | $300,000 | -- |
Source: Public Records
Mortgage History
| Date | Status | Borrower | Loan Amount |
|---|---|---|---|
| Previous Owner | Salvatore Samuel | $20,000 | |
| Previous Owner | Salvatore Samuel | $240,000 | |
| Previous Owner | Salvatore Samuel | $100,000 |
Source: Public Records
Tax History
| Year | Tax Paid | Tax Assessment Tax Assessment Total Assessment is a certain percentage of the fair market value that is determined by local assessors to be the total taxable value of land and additions on the property. | Land | Improvement |
|---|---|---|---|---|
| 2025 | $44 | $371,900 | $44,100 | $327,800 |
| 2024 | $3,935 | $344,000 | $44,100 | $299,900 |
| 2023 | $3,760 | $311,800 | $44,100 | $267,700 |
| 2022 | $3,677 | $279,400 | $40,100 | $239,300 |
| 2021 | $3,643 | $259,500 | $40,100 | $219,400 |
| 2020 | $3,476 | $246,200 | $40,100 | $206,100 |
| 2019 | $3,235 | $233,400 | $33,900 | $199,500 |
| 2018 | $2,885 | $215,000 | $42,100 | $172,900 |
| 2017 | $2,978 | $213,000 | $40,100 | $172,900 |
| 2016 | $2,811 | $196,700 | $40,100 | $156,600 |
| 2015 | $2,793 | $204,300 | $45,500 | $158,800 |
| 2014 | $2,687 | $204,300 | $45,500 | $158,800 |
Source: Public Records
Map
Nearby Homes
Your Personal Tour Guide
Ask me questions while you tour the home.