
Seller's Agent in 2024
Jack Silvers
River City Realty
(316) 993-4040
1 in this area
55 Total Sales
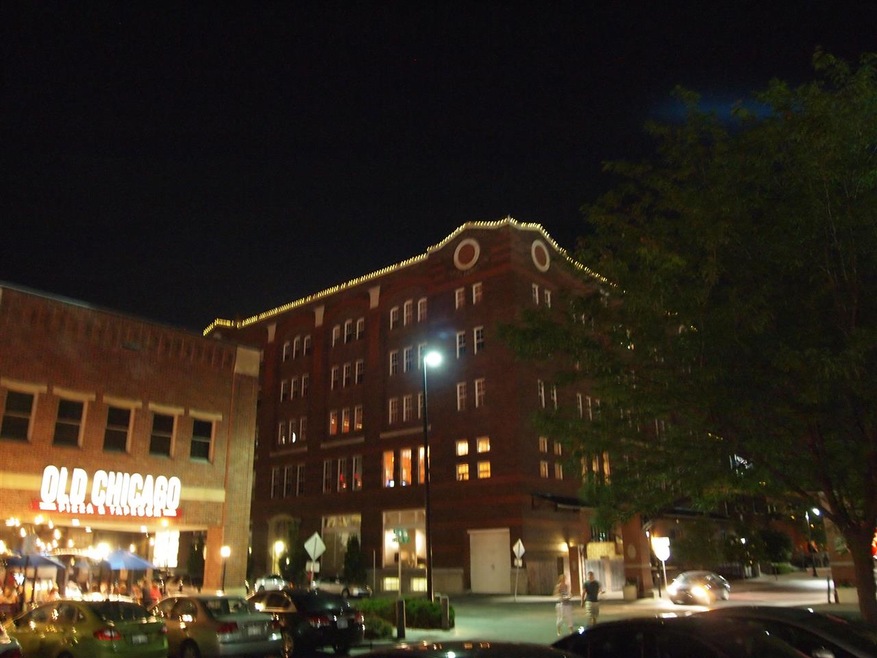
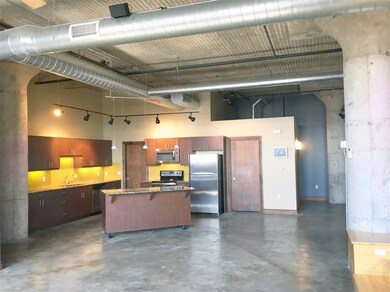
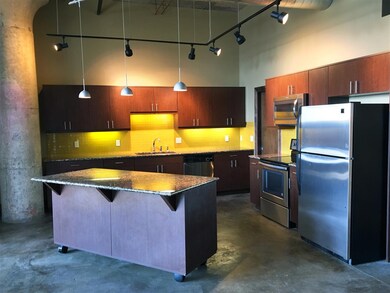
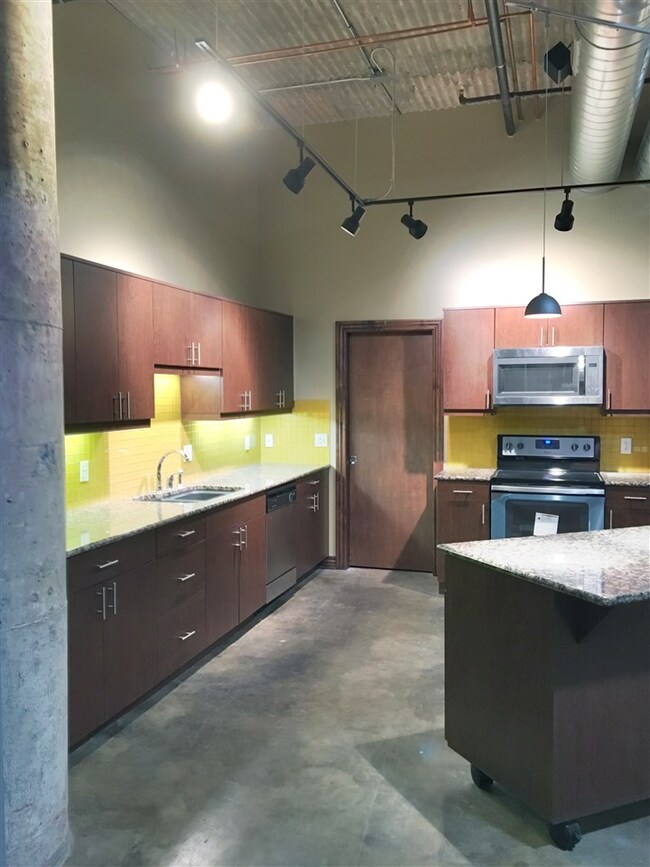
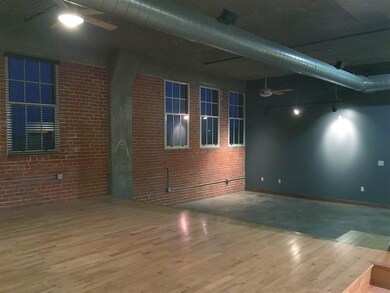
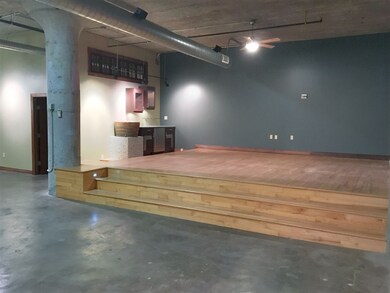
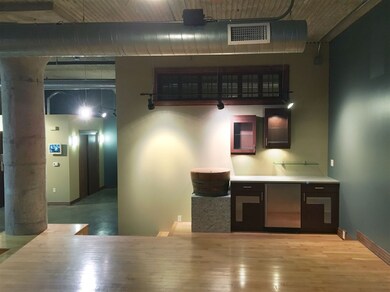
Living in a loft is LIVING! The Rumley is in the center of Old Town. You are within a block of Old Chicago, Lemongrass, Sabor, Blue Fin, Morts, Warren theater and so many great hot spots. The loft building is gorgeous and has many features! It has two bedrooms, two bathrooms and parking for two. The ceiling height is 12'4". The space gives you a WOW as soon as you walk in. The living space is elevated on a wood platform with a bar to enhance social gatherings. There are surround sound speakers, granite, glass backsplash, stainless appliances, stackable washer/dryer and remote ceiling fans. Treat yourself and choose more than four walls. Choose a different way to live!
Last Agent to Sell the Property
Keller Williams Hometown Partners License #00223858 Listed on: 06/13/2017
| Date | Status | Loan Amount | Loan Type |
|---|---|---|---|
| Closed | $250,000 | Future Advance Clause Open End Mortgage | |
| Closed | $200,000 | New Conventional |
| Date | Event | Price | Change | Sq Ft Price |
|---|---|---|---|---|
| 05/10/2024 05/10/24 | Sold | -- | -- | -- |
| 04/01/2024 04/01/24 | Pending | -- | -- | -- |
| 02/16/2024 02/16/24 | For Sale | $499,000 | +38.6% | $190 / Sq Ft |
| 09/25/2023 09/25/23 | Sold | -- | -- | -- |
| 08/10/2023 08/10/23 | Pending | -- | -- | -- |
| 08/02/2023 08/02/23 | For Sale | $359,900 | +6.2% | $165 / Sq Ft |
| 07/14/2023 07/14/23 | Sold | -- | -- | -- |
| 05/11/2023 05/11/23 | Sold | -- | -- | -- |
| 04/23/2023 04/23/23 | Pending | -- | -- | -- |
| 04/18/2023 04/18/23 | For Sale | $339,000 | +1.3% | $165 / Sq Ft |
| 04/14/2023 04/14/23 | Sold | -- | -- | -- |
| 04/04/2023 04/04/23 | Pending | -- | -- | -- |
| 04/01/2023 04/01/23 | For Sale | $334,500 | -1.6% | $157 / Sq Ft |
| 03/17/2023 03/17/23 | Pending | -- | -- | -- |
| 02/27/2023 02/27/23 | For Sale | $340,000 | -5.3% | $180 / Sq Ft |
| 05/17/2022 05/17/22 | Sold | -- | -- | -- |
| 05/02/2022 05/02/22 | Sold | -- | -- | -- |
| 04/19/2022 04/19/22 | Pending | -- | -- | -- |
| 04/15/2022 04/15/22 | For Sale | $359,000 | +19.9% | $166 / Sq Ft |
| 06/11/2021 06/11/21 | Sold | -- | -- | -- |
| 04/12/2021 04/12/21 | Pending | -- | -- | -- |
| 03/05/2021 03/05/21 | For Sale | $299,500 | +0.2% | $140 / Sq Ft |
| 10/09/2020 10/09/20 | Pending | -- | -- | -- |
| 10/09/2020 10/09/20 | For Sale | $299,000 | +4.9% | $140 / Sq Ft |
| 09/18/2020 09/18/20 | Sold | -- | -- | -- |
| 08/15/2020 08/15/20 | Pending | -- | -- | -- |
| 08/15/2020 08/15/20 | For Sale | $285,000 | -32.9% | $136 / Sq Ft |
| 08/30/2019 08/30/19 | Sold | -- | -- | -- |
| 08/11/2019 08/11/19 | Pending | -- | -- | -- |
| 08/05/2019 08/05/19 | For Sale | $425,000 | +70.1% | $163 / Sq Ft |
| 12/11/2017 12/11/17 | Sold | -- | -- | -- |
| 10/15/2017 10/15/17 | Pending | -- | -- | -- |
| 09/15/2017 09/15/17 | Sold | -- | -- | -- |
| 08/06/2017 08/06/17 | Pending | -- | -- | -- |
| 08/04/2017 08/04/17 | For Sale | $249,900 | -9.1% | $134 / Sq Ft |
| 06/13/2017 06/13/17 | For Sale | $275,000 | -1.4% | $129 / Sq Ft |
| 05/05/2017 05/05/17 | Sold | -- | -- | -- |
| 03/31/2017 03/31/17 | Pending | -- | -- | -- |
| 01/20/2017 01/20/17 | For Sale | $279,000 | -25.6% | $136 / Sq Ft |
| 05/19/2015 05/19/15 | Sold | -- | -- | -- |
| 03/19/2015 03/19/15 | Pending | -- | -- | -- |
| 09/22/2014 09/22/14 | For Sale | $375,000 | +50.0% | $149 / Sq Ft |
| 08/06/2014 08/06/14 | Sold | -- | -- | -- |
| 07/25/2014 07/25/14 | Pending | -- | -- | -- |
| 07/09/2014 07/09/14 | For Sale | $250,000 | -7.1% | $122 / Sq Ft |
| 08/26/2013 08/26/13 | Sold | -- | -- | -- |
| 07/21/2013 07/21/13 | Pending | -- | -- | -- |
| 03/21/2013 03/21/13 | For Sale | $269,000 | +25.2% | $129 / Sq Ft |
| 03/19/2013 03/19/13 | Sold | -- | -- | -- |
| 02/05/2013 02/05/13 | Pending | -- | -- | -- |
| 01/24/2013 01/24/13 | For Sale | $214,900 | -52.2% | $114 / Sq Ft |
| 10/05/2012 10/05/12 | Sold | -- | -- | -- |
| 09/13/2012 09/13/12 | Pending | -- | -- | -- |
| 03/08/2012 03/08/12 | For Sale | $450,000 | -- | $176 / Sq Ft |
| Year | Tax Paid | Tax Assessment Tax Assessment Total Assessment is a certain percentage of the fair market value that is determined by local assessors to be the total taxable value of land and additions on the property. | Land | Improvement |
|---|---|---|---|---|
| 2025 | $5,290 | $46,369 | $17,929 | $28,440 |
| 2023 | $5,290 | $41,308 | $7,682 | $33,626 |
| 2022 | $4,603 | $38,468 | $7,245 | $31,223 |
| 2021 | $4,421 | $36,287 | $7,245 | $29,042 |
| 2020 | $4,202 | $34,425 | $7,245 | $27,180 |
| 2019 | $4,711 | $38,353 | $7,383 | $30,970 |
| 2018 | $4,429 | $35,926 | $7,383 | $28,543 |
| 2017 | $4,266 | $0 | $0 | $0 |
| 2016 | $4,057 | $0 | $0 | $0 |
| 2015 | -- | $0 | $0 | $0 |
| 2014 | -- | $0 | $0 | $0 |
Seller's Agent in 2024
Jack Silvers
River City Realty
(316) 993-4040
1 in this area
55 Total Sales
Buyer's Agent in 2024
Antoine L. Agnew
Keller Williams Hometown Partners
(316) 200-0100
18 in this area
142 Total Sales
Seller's Agent in 2023
Karen Hampton
RE/MAX Premier
(316) 641-9442
1 in this area
142 Total Sales
Buyer's Agent in 2023
Phyllis Zimmerman
Berkshire Hathaway PenFed Realty
(316) 734-7411
1 in this area
151 Total Sales
Buyer's Agent in 2023
Lesley Hodge
Real Broker, LLC
(316) 655-4069
1 in this area
227 Total Sales
C
Buyer's Agent in 2023
Claire Willenberg
Berkshire Hathaway PenFed Realty
1 in this area
25 Total Sales
Source: South Central Kansas MLS
MLS Number: 536804
APN: 125-21-0-24-03-001.28
Disclaimer: Certain information contained herein is derived from information provided by parties other than Homes.com. All information provided is deemed reliable, but is not guaranteed to be accurate and should be independently verified.
![]() IDX information is provided exclusively for personal, non-commercial use, and may not be used for any purpose other than to identify prospective properties consumers may be interested in purchasing. This information is not verified for authenticity or accuracy, is not guaranteed and may not reflect all real estate activity in the market. © 1993-2025 South Central Kansas Multiple Listing Service, Inc. All rights reserved.
IDX information is provided exclusively for personal, non-commercial use, and may not be used for any purpose other than to identify prospective properties consumers may be interested in purchasing. This information is not verified for authenticity or accuracy, is not guaranteed and may not reflect all real estate activity in the market. © 1993-2025 South Central Kansas Multiple Listing Service, Inc. All rights reserved.