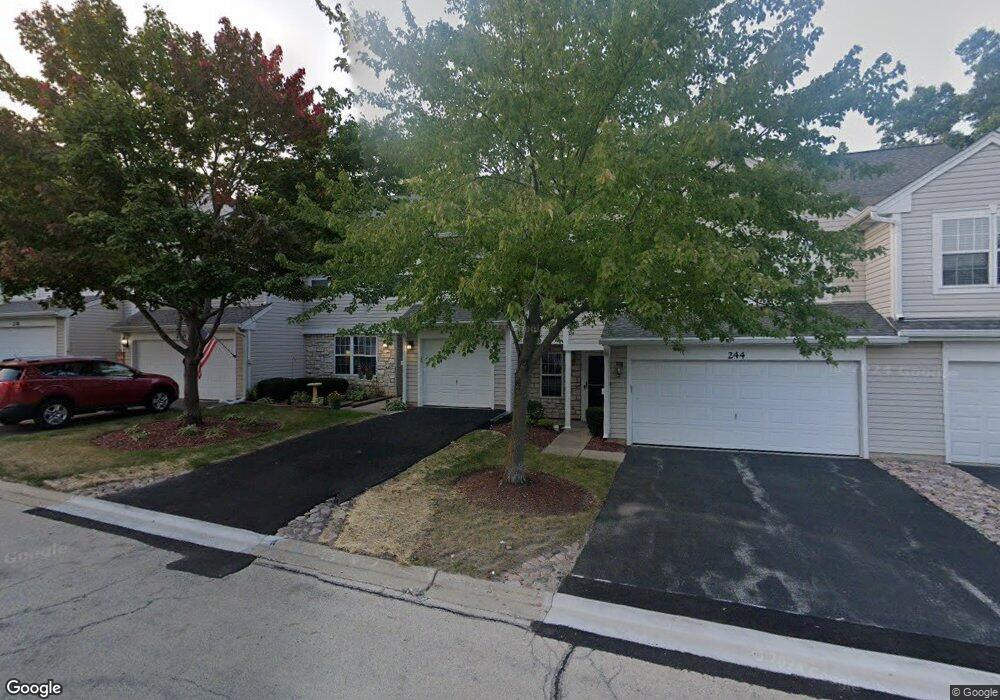
242 Rainier Way Unit 7242 Fox Lake, IL 60020
Estimated Value: $224,600 - $267,000
--
Bed
2
Baths
1,376
Sq Ft
$179/Sq Ft
Est. Value
About This Home
This home is located at 242 Rainier Way Unit 7242, Fox Lake, IL 60020 and is currently estimated at $246,900, approximately $179 per square foot. 242 Rainier Way Unit 7242 is a home located in Lake County with nearby schools including Big Hollow Primary School, Big Hollow Elementary School, and Big Hollow Middle School.
Ownership History
Date
Name
Owned For
Owner Type
Purchase Details
Closed on
Oct 18, 2000
Sold by
Oconnor William E and Oconnor Agnes E
Bought by
Calderone Charlene
Current Estimated Value
Home Financials for this Owner
Home Financials are based on the most recent Mortgage that was taken out on this home.
Original Mortgage
$105,300
Outstanding Balance
$38,512
Interest Rate
7.96%
Mortgage Type
Purchase Money Mortgage
Estimated Equity
$208,389
Purchase Details
Closed on
Dec 9, 1996
Sold by
Oconnor Agnes E
Bought by
Oconnor William E and Oconnor Agnes E
Purchase Details
Closed on
Aug 22, 1996
Sold by
Harris Bank Palatine
Bought by
Oconnor Agnes E
Home Financials for this Owner
Home Financials are based on the most recent Mortgage that was taken out on this home.
Original Mortgage
$40,000
Interest Rate
8%
Mortgage Type
Purchase Money Mortgage
Create a Home Valuation Report for This Property
The Home Valuation Report is an in-depth analysis detailing your home's value as well as a comparison with similar homes in the area
Home Values in the Area
Average Home Value in this Area
Purchase History
| Date | Buyer | Sale Price | Title Company |
|---|---|---|---|
| Calderone Charlene | $117,000 | -- | |
| Oconnor William E | -- | -- | |
| Oconnor Agnes E | $119,000 | Ticor Title Insurance Compan |
Source: Public Records
Mortgage History
| Date | Status | Borrower | Loan Amount |
|---|---|---|---|
| Open | Calderone Charlene | $105,300 | |
| Previous Owner | Oconnor Agnes E | $40,000 |
Source: Public Records
Tax History Compared to Growth
Tax History
| Year | Tax Paid | Tax Assessment Tax Assessment Total Assessment is a certain percentage of the fair market value that is determined by local assessors to be the total taxable value of land and additions on the property. | Land | Improvement |
|---|---|---|---|---|
| 2024 | $3,413 | $55,872 | $7,230 | $48,642 |
| 2023 | $3,366 | $50,041 | $6,811 | $43,230 |
| 2022 | $3,366 | $42,304 | $4,376 | $37,928 |
| 2021 | $3,279 | $39,876 | $4,125 | $35,751 |
| 2020 | $3,262 | $39,306 | $4,066 | $35,240 |
| 2019 | $3,134 | $37,693 | $3,899 | $33,794 |
| 2018 | $2,953 | $36,394 | $6,426 | $29,968 |
| 2017 | $2,865 | $33,639 | $5,940 | $27,699 |
| 2016 | $2,847 | $30,766 | $5,433 | $25,333 |
| 2015 | $2,667 | $28,710 | $5,070 | $23,640 |
| 2014 | $2,496 | $27,414 | $4,841 | $22,573 |
| 2012 | $2,533 | $28,319 | $5,001 | $23,318 |
Source: Public Records
Map
Nearby Homes
- 314 Mastodon Dr
- 69 Washington St
- 541 Foxridge Dr Unit 13D
- 29 S Hickory Ave
- 38 S Maple Ave
- 235 E Grand Ave
- 576 Windsor Dr Unit 370
- 8 S Lake Ave
- 605 Rollins Rd
- 54 Hillcrest Ave
- 37 Hillcrest Ave
- 10 S Maple Ave
- 994 Reserve Ct
- 35242 N Moody St
- 43 Lippincott Rd
- 42 Rushmore Rd
- 50 N Lake Ave
- 35403 N 2nd Ave
- 35105 N Ingleside Dr
- 35397 N 1st Ave
- 217 Rainier Way Unit 2217
- 215 Rainier Way Unit 2215
- 213 Rainier Way Unit 2213
- 211 Rainier Way Unit 2211
- 209 Rainier Way Unit 2209
- 229 Rainier Way Unit 3229
- 227 Rainier Way Unit 3227
- 225 Rainier Way Unit 3225
- 223 Rainier Way Unit 3223
- 221 Rainier Way Unit 3221
- 237 Rainier Way Unit 4237
- 235 Rainier Way Unit 4235
- 233 Rainier Way Unit 4233
- 231 Rainier Way Unit 4231
- 230 Rainier Way Unit 8230
- 228 Rainier Way Unit 8228
- 224 Rainier Way Unit 8224
- 222 Rainier Way Unit 8222
- 246 Rainier Way Unit 7246
- 244 Rainier Way Unit 7244